Wall Street experienced a strong Thanksgiving week, largely erasing losses from the preceding volatile period. Increasing hopes of an interest rate cut by the Federal Reserve next month helped fuel the rally. After a shaky few weeks, tech stocks surged last week, driving the NASDAQ to its largest weekly gain in quite some time. As more economic data is released following the reopening of the federal government, investors are able to get a better grasp on the state of the economy. For instance, initial job claims fell, while durable goods orders and retail sales rose. However, producer prices also advanced, further evidence of escalating inflationary pressures. Each market sector ended last week with gains, led by consumer discretionary, communication services, materials, and information technology. The yield on 10-year Treasuries continued to slip as growing expectations of a rate cut help push bond prices higher, weighing on yields. Oversupply continued to drag crude oil prices lower.
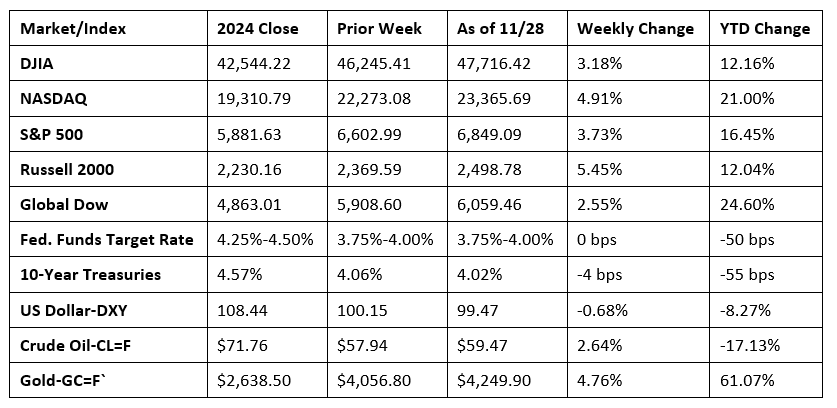
Chart reflects price changes, not total return. Because it does not include dividends or splits, it should not be used to benchmark performance of specific investments.
Last Week’s Economic News
- Retail and food services sales rose 0.2% in September from the previous month and 4.3% from September 2024. Retail trade sales were up 0.1% in September and 3.9% from September 2024. Nonstore (online) retailer sales declined 0.7% in September but rose 6.0% from last year, while food service and drinking places sales were up 0.7% in September and 6.7% from September 2024.
- The Producer Price Index increased 0.3% in September after falling 0.1% in August. Since September 2024, producer prices have increased 2.7%. In September, producer prices for goods rose 0.9%, while prices for services were unchanged from the prior month. Energy prices rose 3.5% in September, while prices for foods advanced 1.1%. Prices less foods, energy, and trade services edged up 0.1% in September after rising 0.3% in August. For the 12 months ended in September, prices less foods, energy, and trade services increased 2.9%.
- October, the first month of fiscal year 2026, saw the federal deficit come in at $284 billion, following a September surplus of $198 billion. Government receipts totaled $404 billion, while outlays were $689 billion. Nearly 54% of October receipts was attributable to income tax receipts ($217 billion), while custom duties (tariffs) totaled $31 billion. Medicare ($151 billion) and Social Security payments ($134 billion) accounted for over 41% of the October government expenditures.
- New orders for long-lasting durable goods increased 0.5% In September. Excluding transportation, new orders increased 0.6%. Excluding defense, new orders ticked up 0.1%. Transportation equipment, up two consecutive months, led the September increase, rising 0.4%. Over the 12 months ended in September, new orders for durable goods rose 7.3%.
- For the week ended November 22, there were 216,000 new claims for unemployment insurance, a decrease of 6,000 from the previous week’s level, which was revised up by 2,000. According to the Department of Labor, the advance rate for insured unemployment claims for the week ended November 15 was 1.3%, unchanged from the previous week’s rate. The advance number of those receiving unemployment insurance benefits during the week ended November 15 was 1,960,000, an increase of 7,000 from the previous week’s level, which was revised down by 21,000. States and territories with the highest insured unemployment rates for the week ended November 8 were New Jersey (2.3%), Washington (2.2%), the District of Columbia (1.9%), Massachusetts (1.9%), California (1.8%), Puerto Rico (1.8%), Alaska (1.7%), Connecticut (1.7%), Nevada (1.7%), Oregon (1.7%), and Rhode Island (1.7%). The largest increases in initial claims for unemployment insurance for the week ended November 15 were in Kentucky (+589), Minnesota (+351), Wisconsin (+211), Delaware (+199), and Texas (+99), while the largest decreases were in Michigan (-5,290), New Jersey (-2,381), California (-2,287), Illinois (-962), and Georgia (-857).
- The national average retail price for regular gasoline was $3.061 per gallon on November 24, $0.001 per gallon less than the prior week’s price and $0.017 per gallon higher than a year ago. Also, as of November 24, the East Coast price increased $0.032 to $2.985 per gallon; the Midwest price dipped $0.049 to $2.858 per gallon; the Gulf Coast price inched up $0.043 to $2.643 per gallon; the Rocky Mountain price fell $0.077 to $2.872 per gallon; and the West Coast price fell $0.050 to $4.070 per gallon.
Eye on the Week Ahead
Slowly but surely, some important economic reports are being made available. However, most of the data that has been released thus far is for September.
The Week Ahead

The information provided is obtained from sources believed to be reliable. Forecasts cannot be guaranteed. Past performance is not a guarantee of future results.
© 2025 Broadridge Financial Solutions, Inc. All Rights Reserved.