For the seventh week in a row, the S&P 500 closed at another all-time high. Bullish traders have supported their buying by pointing to what has been a good earnings season. Factset compilations note that with 55% of companies reporting, 76% of S&P 500 companies have reported positive earnings per share surprises and 67% have reported positive sales surprises. To date, the S&P 500 Q3 earnings growth rate is 4.7%.
The S&P 500 is not at bargain levels. Based on Q3 earnings to date, the forward 12-month P/E ratio for the S&P 500 is 17.9 and above the ten year average PE of 14.1 and the five-year average PE of 15.6. The index is also not at bubble levels. Since its previous peak in late 2007 the S&P 500 has risen at an annualized rate slightly above 5%.
Do not get complacent and allow yourself to become influenced by the most recent market action and accompanying noise. Allocate according to your personal financial plan and stick to your plan in both rising and falling markets. Allowing emotions to rule will result in buying near market tops when the news is rosy and selling near the bottoms when the news is gloomy.
On The One Hand
- New orders for durable goods rose 2.2% in September, well above the consensus expected rise of 1.0%. August was revised 0.3% higher to +2.0%. Orders excluding transportation rose 0.7% in September; August was revised upward by 0.5% to +0.7%. Orders are up 8.3% from a year ago and orders excluding transportation are up 7.5%.
- New single-family home sales shocked forecasters by increasing 18.9% in September to a 667,000 annual rate, far above the consensus expected 554,000. Sales rose in all major regions and were up double digits in all regions but the West. On a year-over-year basis, sales are up 17%.
- Initial unemployment claims for the week rose by 10,000 to 233,000 and continuing claims for week declined by 3,000 to 1.893 million.
- The first estimate for Q3 real GDP growth was a surprising 3.0% at an annual rate, beating the 2.6% consensus expectation. Real GDP is up 2.3% from a year ago. The GDP Price Deflator was up 2.2%, a larger increase than the consensus expectation of 1.8%.
- The University of Michigan’s Index of Consumer Sentiment for October remained at a healthy 100.7 even though it was slightly under the preliminary report of 101.1. The index reading for September was 95.1.
On The Other Hand
Pending home sales, contracts on existing homes, were unchanged in September after declining 2.8% in August. The continued lack of supply of existing homes available for sale continues to hinder the ability of potential first time home buyers to leave the ranks of renters.
All Else Being Equal
Third Quarter GDP came in stronger than expected and even higher than the 2.2% average growth rate of the current expansion, but the markets aren’t signaling the US economy is beginning to accelerate. At the same time, there are no signs of an end to this expansion.
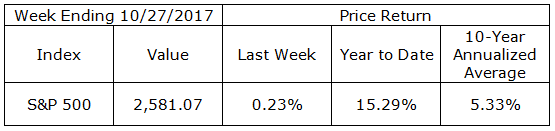
Last Week’s Market
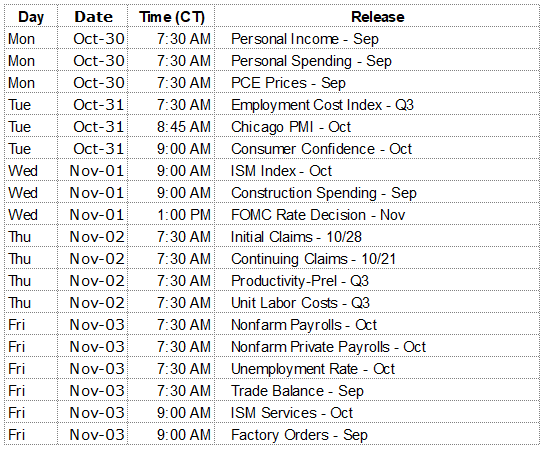
The Week Ahead
The information provided is obtained from sources believed to be reliable. Forecasts cannot be guaranteed. Past performance is not a guarantee of future results.