In the interesting but useless facts category, we have the following:
“Santa Claus tends to come to Wall Street nearly every year, bringing a short, sweet, respectable rally within the last five days of the year and the first two in January. This has been good for an average 1.4% gain since 1969 (1.4% since 1950). Santa’s failure to show tends to precede bear markets, or times stocks could be purchased later in the year at much lower prices.” Jeffrey A. Hirsch and Yale Hirsch, Stock Trader’s Almanac 2016.
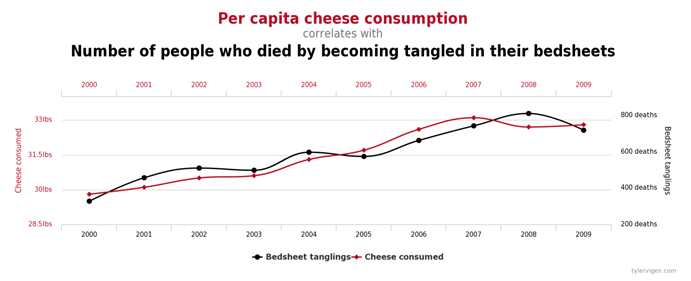
Seasonal correlations like the Santa Claus Rally and the January Effect will be topics of conversation in the financial media for the next several weeks. These are interesting but generally useless bits of data for long term investors. The market’s price action during a particular week or month of the year is no reason for investors to overhaul their portfolios. Correlation does not mean causation as the website Spurious Correlations humorously points out. Below is one example. Check the website for more examples.
What We Are Watching So You Don’t Have To
On The One Hand
- Existing home sales increased 0.7% in November to a seasonally adjusted annual rate of 5.61 million from a revised 5.57 million for October.
- Q3 GDP was revised up more than expected to 3.5% from 3.2%. The GDP Deflator remained at 1.4%.
- Initial claims for the week ending December 17 increased 21,000 to 275,000. Continuing claims for the week ending December 10 rose 15,000 to 2.036 million. Weekly hiccups do not change the trend for initial claims which remain low and an indicator of labor market improvement.
- The headline for durable goods orders reported a decline of 4.6% in November however, excluding transportation orders, the results beat consensus expectations of +0.2% with a gain of 0.5%. Following the 0.9% increase in October, business investment may be picking up.
- The Conference Board’s Leading Economic Index was unchanged in November following an unrevised 0.1% increase for October.
- Personal spending increased 0.2% while October was revised upward to 0.4% from the originally reported 0.3%. Spending is up 4.2% annually.
- The Personal Consumption Expenditures (PCE) Price Index was unchanged in November which leaves the index up 1.4% year-over-year. The core PCE deflator was also unchanged, leaving it at an annual rate of +1.6%.
- The University of Michigan Consumer Sentiment Index for December came in at 98.0, up from the final November reading of 93.8 and higher than the consensus expectation of 94.3.
- On a local note, the Kansas City Fed reported last week that Tenth District manufacturing activity improved considerably to its highest growth rate in over two years. “The Kansas City region was hit hard by the decline in oil prices, but activity is expanding again… This is now four straight months of factory expansion in our region, following a difficult time for many plants in 2015 and much of 2016.”
On The Other Hand
- Personal income was unchanged in November and the October figure was revised downward to +0.5% from the originally reported increase of 0.6%. The recent flat to weak growth in recent months leaves personal income up 3.5% over the past year.
- Sales of new single-family homes declined 1.9% in October to a seasonally adjusted annual rate of 563,000 from a revised September rate of 574,000. The October figure was also lower than the consensus estimate of 587,000.
All Else Being Equal
The plow horse economy, as Brian Wesbury has characterized the current U.S. economy, shows a desire to trot at times. There is little doubt that growth will continue into the New Year.
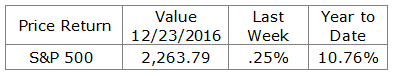
Last Week’s Market
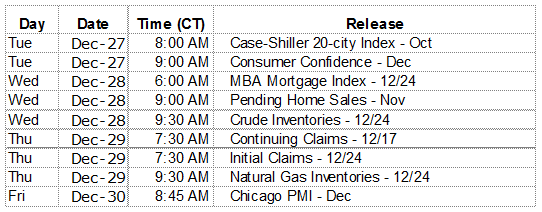
The Week Ahead