Market Fluctuation
Due to multiple requests, we are going to rerun some market statistics we previously provided in our Weekly Updates. The first chart shows the frequency of historical market declines. Such declines are normal occurrences in public markets.
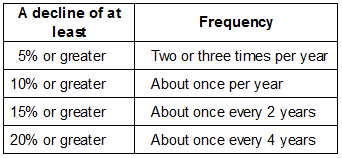
So, when is the next correction going to begin? No one can consistently predict the start, depth or length of market declines. What the chart does tell us is, based on historical data, there is roughly a 100% chance we will experience a 10% market decline every year and a 25% chance the decline will be 20% or greater. These probabilities are of no concern to investors who have committed only long-term money to stocks. Timing the market is futile but time in the market is what has led to success as the chart below demonstrates.
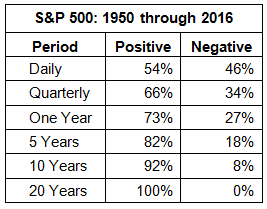
The chart above shows positive versus negative market price changes only. The returns from dividends, about two percent annually, is not included in the results. As always, these charts represent historical frequencies and there is no guarantee these results will repeat in the future.
What We Are Watching So You Don’t Have To
On The One Hand
- Existing home sales increased 3.3% in January to a 5.69 million annual rate. Sales are up 3.8% versus a year ago, the fastest pace since 2007.
- Initial jobless claims rose just 6,000 to 244,000 for the week ending February 18. Continuing claims for the week ending February 11, fell by 17,000 to 2.060 million.
- The University of Michigan’s Index of Consumer Sentiment for February was revised upward to 96.3 from the preliminary reading of 95.7. While lower than the January index level of 98.5, it is above levels not seen since March 2004.
- New home sales rebounded in January, increasing 3.7% from the December sales rate to an annual rate of 555,000.
On The Other Hand
The median new home sales price increased 7.5% year-over-year to $312,900. The mean sales price slipped 1.3% to $360,900.
All Else Being Equal
The details of proposed, long overdue tax and regulatory reforms remain unclear. The employment trend is good but there is room for improvement as many remain underemployed and the number of people who remain outside the workforce continues at historically high levels. Prices are improving but wages have lagged. Economic data shows the slow growth trend continues.
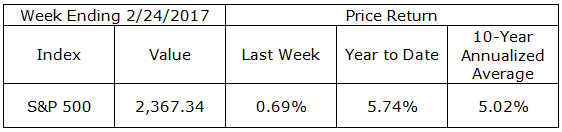
Last Week’s Market
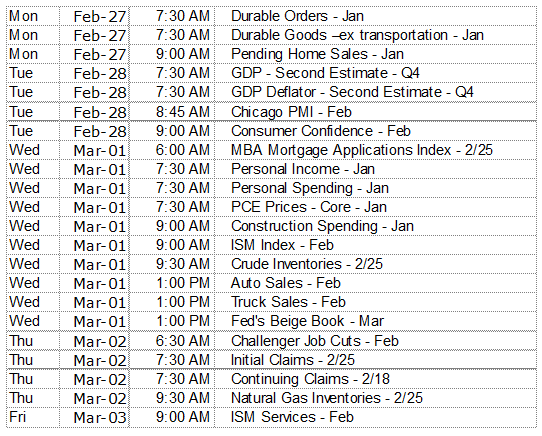
The Week Ahead
The information provided is obtained from sources believed to be reliable. Forecasts cannot be guaranteed. Past performance is not a guarantee of future results.