Owning shares of stock is being part owner of a business. As part owner of a publicly traded corporation, your share of the company may be a tiny fraction of the whole but you are nevertheless part owner of the assets, revenues and earnings of the company. You own a portion of everything the corporation owns: the real estate, the equipment and supplies, the inventory, even the patents and copyrights. You are an owner of a fractional interest in the net assets and earnings power of those assets.
The price you pay or receive for your shares is established in the market. Legendary investor, Benjamin Graham described the market by saying, “In the short run, the market is like a voting machine. But in the long run, the market is like a weighing machine.” What he meant was, over a period of months, the stock market is a popularity contest. Prices change rapidly based on rumors, fads and even manipulation all while the underlying value of the corporate assets you own changes very little from day to day. Long-term, over several business cycles, the unpredictability of emotion gets filtered out and the real underlying value of the company will be reflected in the market value of your shares.
Knowing the difference between participating in a business and taking part in a popularity contest is critical. Predictions of market melt downs need to be put into proper context. Popularity will at times temporarily increase the value of your shares above the underlying value of your fractional ownership of the company. When popularity fades your share values will be below the underlying value of your business. The exact timing of these swings in popularity is not predictable. Investors are business owners. Traders are predictors of popularity contests. Unfortunately too many market participants never understand this difference.
On The One Hand
- The Producer Price Index was unchanged in May which places it up 2.4% on an annual basis. Core prices were up 0.3% for the month putting the annual rate at 2.1%.
- The Consumer Price Index declined 0.1% in May. This placed the government’s 12 month rate of inflation at 1.9%.
- Initial unemployment claims, for the week ending June 10, remained at a healthy level of 237,000 and continuing claims were up just 6,000 to 1.935 million.
- While declining to 27.6 in May, from the previous month’s level of 38.8, the Philadelphia Fed Index remained above zero and signals expectations for continued growth of the manufacturing sector in the region.
- Import prices declined 0.3% in May and April prices were revised downward to +0.2% from the originally reported +0.5%. Export prices declined 0.7% in May following a 0.3% increase in April, revised upward from +0.2%.
On The Other Hand
- Retail sales declined 0.3% in May.
- Business inventories declined 0.2% in April and total business sales were flat for the month. The inventory-to-sales ratio was flat for the month at 1.37.
- Industrial production was flat in May and April was revised up slightly to 1.1%. Manufacturing output declined 0.4%. Capacity utilization declined slightly to 76.6% from 76.7% in April.
- Housing starts were down 5.5% in May and down 2.4% for the 12 month period at a seasonally adjusted annual rate of 1.092 million units. Building permits were down 4.9% with single-family permits coming in 1.9% lower for the month.
All Else Being Equal
Fed President, Janet Yellen, announced the Fed’s decision to raise the fed funds rate one-quarter of one percent to a range of 1% to 1.25%. She also announced the plan to gradually reduce the Fed’s $4.5 trillion of debt holdings sometime “later this year”. The Fed is not planning asset sales, rather it plans to cease reinvest of the proceeds from the maturing debt securities in its portfolio. The rate of reduction is expected to begin at $10 billion per month. The roll off will increase gradually to a level of $30 billion per month and continue until holdings reach the level the Fed deems to be normal. Prior to the financial crisis the Fed’s holdings were about $800 billion.
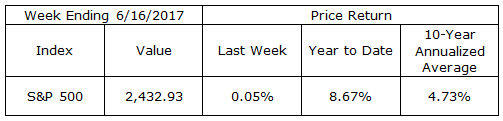
Last Week’s Market
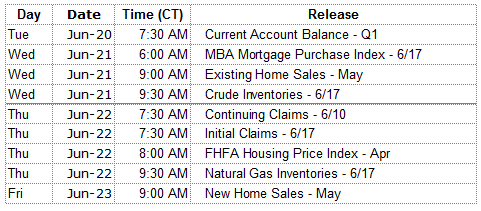
The Week Ahead
The information provided is obtained from sources believed to be reliable. Forecasts cannot be guaranteed. Past performance is not a guarantee of future results.