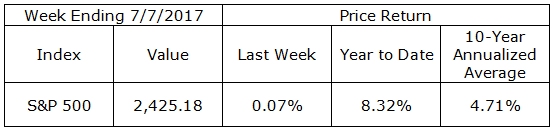
The S&P 500 finished the week at 2,425 and has not traded outside a range bounded by one-percent on either side of that level for the past 6 weeks. The S&P 500 has not had a 5% correction since February 11, 2016, seventeen months ago. Historically, the index has averaged three corrections of 5% or greater every 12 months. On average one of those extends to 10%.
After drifting lower to a yield of 2.14% as recently as June 26, the 10-year Treasury note finished the week at 2.39%, the highest yield seen since the end of the first quarter. Bond bears (interest rate bulls) will now begin measuring progress as the market moves toward the March 2017 high yield of 2.61%.
Speaking of measuring progress, the dog days of summer are a good time to confirm your personal goals and evaluate your current standing. A good way to begin a review of your retirement plans would be to read Lee Anne Thompson’s article, Retirement “Facts” That May Be Fiction, on our website. The piece addresses some of the many popular retirement plan assumptions and rules of thumb which may or may not apply to you. It is called personal financial planning for good reason. More often than not, your personal situation cannot be solved by following a collection of rules of thumb.
On The One Hand
- The ISM Manufacturing Index for June, at 57.8, was above expectations as well as the May level of 54.9. The major measures of activity were all higher in June, and all stand above 50, signaling growth. The new orders index rose to 63.5 from 59.5.
- Initial unemployment claims increased by 4,000 to 248,000 in the week ending July 1. Continuing claims increased by 11,000 to 1.956 million.
- The trade deficit declined in May, coming in at $46.5 billion. While exports increased $0.9 billion in May and imports declined by $0.2 billion, both imports and exports are up from a year ago: exports by 5.4%, imports by 6.6%. Expanding trade with the rest of the world is positive.
- The June ISM Non-Manufacturing Index was up to 57.4 from 56.9 in May. This was the 90th consecutive month the index has been above 50.0, the dividing line between expansion and contraction.
- June nonfarm payrolls increased by 222,000, including revisions to the May and April reports, nonfarm payrolls increased by 269,000. June average hourly earnings increased 0.2% for the month or 2.5% over the last 12 months. The average workweek in June was 34.5 hours, up from 34.4 hours in May.
On The Other Hand
- Total construction spending was flat in May and April was revised upward to a decline of 0.7% from the original -1.4%. Residential construction spending was down 0.5% while nonresidential spending was up 0.3%.
- Light vehicle sales were at a seasonally adjusted annual rate of 16.51 million units in June, 1.7% below the 16.80 million sales rate for June 2016.
- Factory orders declined 0.8% in May on top of a downwardly revised 0.3% decrease for April. On a brighter note orders for nondefense capital goods excluding aircraft increased 0.2%.
All Else Being Equal
The uptick in the unemployment rate to 4.4% was due to a 361,000 increase in the labor force, which is good news. At 62.8%, the participation rate remains low by the standards of the last 40 years, but the 12-month moving average has been gradually rising since early 2016. The economy is producing solid payroll growth but no real wage inflation. The gain in total earnings plus low debt service ratios for households leaves plenty of room for more purchasing power.
Last Week’s Market
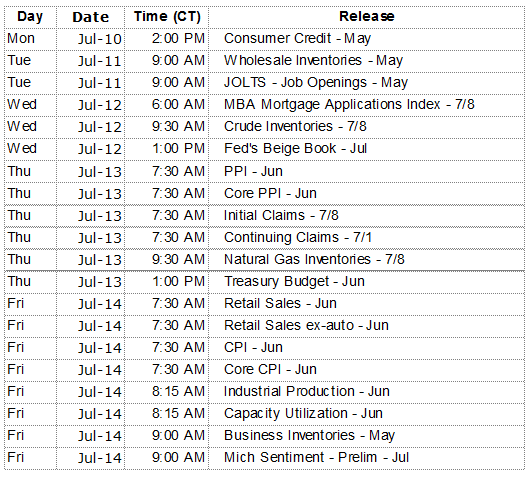
The Week Ahead
The information provided is obtained from sources believed to be reliable. Forecasts cannot be guaranteed. Past performance is not a guarantee of future results.