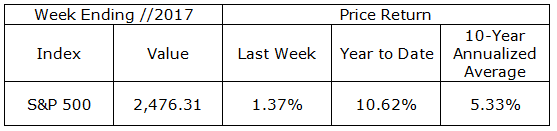
Interest rates, as measured by Treasury instruments, were generally flat for the week. Stocks advanced with the S&P 500 gaining 1.37%. Gold rose 3% to its highest level since October 2016.
As we move into September, historically the worst month for stocks, it will be interesting to watch for a turn in psychology sufficient to trigger the correction many have been looking for. Since 1950, the average S&P 500 price return for all calendar months has been about 1.30% with just 40% of calendar months resulting in a negative return. By comparison the average price return for all Septembers over the same period has been a negative 0.51% with 55% of all Septembers ending lower for the month. Note, these figures do not include the dividend return which is a significant component of stock returns.
Market history is interesting and traders have and will continue to use it to try to gain an edge. Investors however, own stock in companies in anticipation of multiple years of above average growth. Be ready to hear and read about potential September trades. If you are an investor, be an investor. Do not let yourself get conned by the hype into believing you are a trader. Investors will be watching calmly for bargains should we see another sale in September stock prices.
On The One Hand
- The Conference Board’s Consumer Confidence Index increased to 122.9 in August, up from 120.0 in July, which was downwardly revised from 121.1 in this month’s release.
- Real Q2 GDP was revised to a 3.0% annual growth rate from its initial rate of 2.6%. The upward revision was mainly due to faster growth in personal consumption and business investment.
- Personal income rose 0.4% in July, up 2.7% in the past year. Personal consumption increased 0.3%. Spending is up 4.2% year over year.
- The personal consumption expenditure (PCE) deflator (consumer inflation) rose 0.1% in July and is up 1.4% versus a year ago. The rates for core-PCE were the same.
- Initial jobless claims rose 1,000 to a still low 236,000, while continuing claims fell 12,000 to 1.94 million. This was the 130th consecutive week for which initial jobless claims have been under 300,000.
- The Chicago Purchasing Managers Index checked in at 58.9 for August, unchanged from the July reading and the consensus estimate for most recent month.
- The Institute of Supply Management (ISM) manufacturing index was reported at 58.8 for August, up from 56.3 in July and the 12th consecutive month the index has been above 50 which signals expansion.
- The final August reading for the University of Michigan Consumer Sentiment report was 96.8, lower than the preliminary reading but up nicely from the 93.4 level reported for July.
On The Other Hand
- Nonfarm payrolls increased 156,000 in August, behind the consensus expected 180,000. Revisions subtracted 41,000 from the June and July nonfarm payroll figures.
- The unemployment rate was 4.4%, up one-tenth of a percent from both the July rate and August expectations. The labor force participation rate remained unchanged at 62.9% in August.
- Construction spending declined 0.6% in July following a downwardly revised June figure of -1.4%. A slowdown in spending on commercial, education, and health care related structures more than offset the rise in home building. Year-over-year, total construction spending is up just 1.8%, with public construction spending down 5.6% and private construction spending up 4.1%.
- For the sixth straight month, U.S. light vehicle sales for August were at a seasonally adjusted annual rate (SAAR) of 16.14 million units in August, lower than the SAAR of 16.77 million units for July. The August rate was 6.3% below that of the August 2016. Total domestic sales declined to 12.68 million from 13.19 million in July. Domestic auto sales were down 3.3% in August and 12.3% below August 2016. Domestic truck sales declined 3.9% to 8.32 million units in August from 8.68 million in July and 3.9% below the year-ago period.
- All Else Being Equal
The majority of strategists we follow believe inflation is still in a long term accelerating trend. Most expect inflation to inch towards the Fed’s 2% inflation target near year end. The Fed’s planned balance sheet normalization is now expected to begin on October 1 and another Fed Funds increase in December is likely. On Friday, the Atlanta Fed updated its estimate for real Q3 GDP growth to 3.2%. The latest from the New York Fed Nowcast is that real Q3 GDP growth is currently 2.2%.
Last Week’s Market
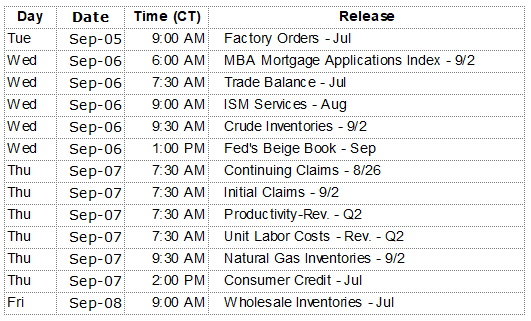
The Week Ahead
The information provided is obtained from sources believed to be reliable. Forecasts cannot be guaranteed. Past performance is not a guarantee of future results.