The S&P 500 began the year at 2,673.61 and from there continued its two-year rally to January 26th posting an all-time high close of 2,872.87. At that point, the index was up 57.07%, excluding dividends, from its February 11, 2016, close of 1,829.08. From the new high, stock prices became volatile as the index corrected 10.16% with a close at 2,581.00 on February 8th. Price action remained volatile throughout the balance of the quarter with the S&P 500 finishing at 2,640.87, down 1.22% for the quarter and year and 8.08% below its January high.
The Fed continued its scheduled Fed Funds rate increases and market rates began to rise. Rates began the year yielding 0.64% on the 2-Year and 1.64% on the 10-Year. During the quarter, we saw rates as high as 2.34% and 2.94% respectively. At quarter’s end, the 2-Year Treasury yield was 2.27% and the 10-Year Treasury settled at 2.74%.
While price-to-earnings (P/E) multiples may have peaked in the quarter we expect stock prices to be higher later this year as earnings continue to grow. Volatility will continue in the intermediate-term and stock prices will likely test recent lows. It would not be surprising to see the correction to extend into the 15% range during the second quarter. We will use further weakness to add to holdings in financially sound companies with good growth prospects.
On The One Hand
- The third estimate for fourth quarter 2017 real GDP growth was revised up to 2.9% from the previous estimate of 2.5%. For the year, real GDP grew at the rate of 2.3%.
- Personal income increased 0.4% in February. Personal spending rose 0.2%. The personal savings rate increased to 3.4% from 3.2% in January.
- Inflation remains moderate with a PCE Price Index increase of 0.1% in February and a 1.8% year-over-year rate.
- Initial unemployment claims declined 12,000 to 215,000, taking the four-week moving average down 500 to 224,500. Continuing claims increased by 35,000 to 1.871 million.
On The Other Hand
- The Consumer Confidence Index declined 127.7 in March from 130.0 in February. The March dip was insignificant considering the February reading was a level not seen since 2000.
- The Chicago Purchasing Managers Index declined in March for the third consecutive month to 57.4 from 61.9.
- The final University of Michigan Index of Consumer Sentiment for March declined to 101.4 from 102.0 preliminary reading. After the decline, it still remains near the index’s April 2004 level.
All Else Being Equal
Economic growth continues with no significant weakness on the horizon. The Atlanta Fed raised its GDPNow estimate for Q1 real GDP growth to 2.4% from the previous week’s 1.8%.
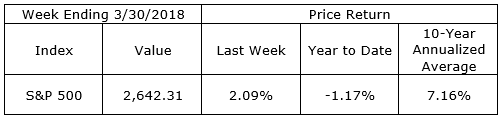
Last Week’s Market
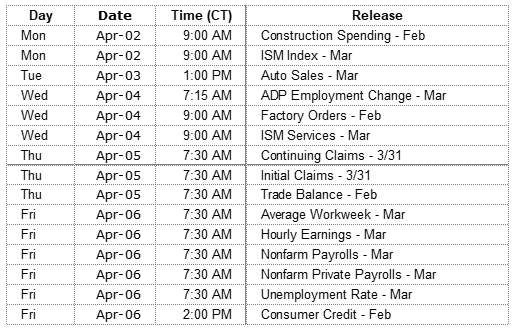
The Week Ahead
The information provided is obtained from sources believed to be reliable. Forecasts cannot be guaranteed. Past performance is not a guarantee of future results.