The estimate for corporate earnings growth for the first quarter of this year now stands at 21%, up from 18% at the beginning of April. Although slightly lower for the week, stock prices in the month of April have responded positively. As of Friday, April month-to-date increases in the indices have been 1.1% for the S&P 500, 2.6% for the Dow Industrials, and 3.8% for the NASDAQ. Two-thirds of the S&P 500 constituents, by market cap, have yet to report Q1 results.
Last week the yield on the benchmark U.S. 10-year Treasury note topped 3% for the first time in over four years, putting it one-half of a percentage point higher since the beginning of the year. The 2-year and 10-year notes finished the week at 2.24% and 2.96%, respectively, leaving the spread at 48 basis points and nowhere near the inversion market watchers have been fretting about.
On The One Hand
- Existing home sales rose more than expected in March, posting increases for the second month in a row. Sales of previously-owned homes rose 1.1% in March to a 5.6 million annual rate.
- New home sales were a surprise in March, beating even the most optimistic forecasts, posting the second highest sales pace since 2007. Sales of new homes rose 4.0% in March and are now up 8.8% from a year ago.
- The Consumer Confidence Index increased to 128.7 in April from a downwardly revised (-0.7) 127.0 in March. The index remains near levels not seen since 2000.
- Initial unemployment claims were 209,000, a decrease of 24,000. This is the lowest level for initial claims since December 6, 1969 when it was 202,000. The 4-week moving average was 229,250, a decrease of 2,250 from the previous week’s revised average.
- Orders for durable goods for March increased 2.6%, due to the 7.6% jump in transportation equipment orders, which offset a 0.1% decline in orders of non-defense capital goods, excluding aircraft.
- The Commerce Department reported real gross domestic product (GDP), the value of all goods and services produced in the U.S., adjusted for inflation, rose at an annual rate of 2.3% in the first quarter of 2018.
- The GDP Price Deflator was up 2.0%, down slightly from 2.3%, which was reported in the fourth quarter.
- Wages, salaries, and benefits are rising. The first quarter employment cost index rose 0.8%, compared to 0.6% in the fourth quarter. Wages and salaries, approximately 70% of compensation costs, were 0.9% higher while benefit costs rose 0.7%. On an annual basis, wages and salaries were up 2.7% and benefit costs increased 2.6% for the 12 months ending March 2018.
On The Other Hand
- The FHFA index, which measures prices for homes financed by conforming mortgages, increased 0.6% in February and is up 7.2% versus a year ago, an acceleration from the 6.7% gain in the twelve months ending February 2017.
- The Richmond Fed index, a measure of mid-Atlantic factory sentiment, fell unexpectedly to -3 in April from +15 in March, its first negative reading since late 2016.
- The final Index of Consumer Sentiment figure for the month of April came in at 98.8, down from 101.4 in March. Positive opinions on tax reform were outweighed slightly by negative trade tariff opinions.
All Else Being Equal
With the improvement in compensation rates we are looking for at least a small increase in the employment participation rate in coming months.
The University of Michigan’s detail on its sentiment survey indicate consumers do not anticipate an imminent downturn in the economy, but the length of the expansion has left them apprehensive about future trends.
With the first official Q1 report behind us, the Atlanta Fed is now looking at Q2 with an early GDPNow forecast of 4.1% real growth.
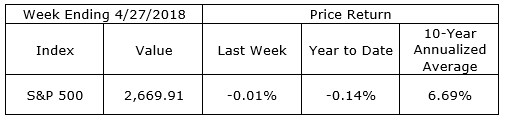
Last Week’s Market
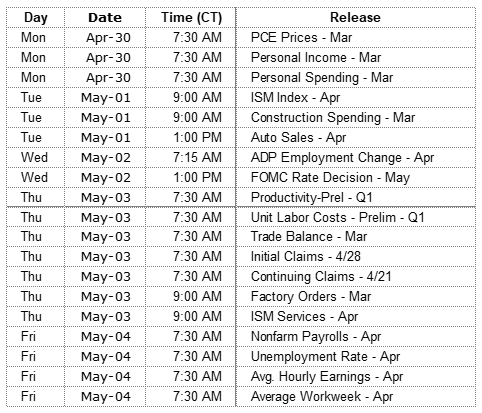
The Week Ahead
The information provided is obtained from sources believed to be reliable. Forecasts cannot be guaranteed. Past performance is not a guarantee of future results.