The earnings per share growth rate for companies reporting to date has been 27.3%, lifting the blended growth estimate for all S&P 500 companies to 25% from the original estimate of 18%. In response, the financial news headline generators are cranking out a parade of potential threats which might be holding stocks back or worse, send them lower.
Stock price movement over the past 3 or 4 weeks is insignificant. As we have said many times before, short-term market moves are emotional, fickle and unpredictable. Financial news sources do not know what your plans are for buying a house, educating your children, or investing for your retirement. They have no fiduciary duty to report what is in your best interest. Those news sources depend on attracting viewers in order to generate ad revenues and it is well known that bad news is what attracts viewers.
Investors are emotional, we cannot help it. Yet, we look for rational explanations for each of the daily, weekly, monthly and quarterly changes in market prices. A look through history shows short-term moves are based on unpredictable emotions. In fact, the market declined in the short-term because sellers were more anxious than buyers. The reverse is true for up days, buyers were more anxious than sellers. Throughout history, the causes of anxiety have seldom, some would say never, developed into significant, rational reasons for overhauling one’s investment portfolio.
Long-term investors might take a step back and realize that after the straight-up increase of 57.07% in the S&P 500 between February 11, 2016, and January 26, 2018, and the meager 10.16% correction which is still in the process of being tested, the rebound in earnings which has been anticipated is occurring. A rational analysis of recent news recognizes there has been some surprise in earnings to the upside but we had already experienced considerable surprise to the upside in stock prices over the last several years in anticipation of the current earnings rebound. This may be the high-water mark in terms of earnings growth rates but this does not mean earnings are about to decline. We fully anticipate earnings growth to continue into the foreseeable future, just not at the recent 25% annual rate.
On The One Hand
- Personal income rose 0.3% in March. Personal consumption increased 0.4% in March. The PCE deflator was unchanged in March but is up 2.0% versus a year ago.
- The Chicago PMI rose to 57.6 in April from 57.4 in March.
- Preliminary first quarter labor productivity increased at an annualized rate of 0.7% compared to an upwardly revised 0.3% annualized rate in the fourth quarter. Unit labor costs were up 2.7%, up from a downwardly revised 2.1% increase (from 2.5%) for the fourth quarter.
- The trade deficit posted its largest monthly decline since 2009. What matters most is the total volume of trade, exports and exports combined. Total trade was flat in March but remained near its all-time high. Year-over-year, total trade is up nearly 9%.
- Initial unemployment claims rose 2,000 last week to 211,000, the second lowest reading since 1969. Continuing claims fell 77,000 to 1.76 million, the lowest reading since 1973.
- Factory orders increased 1.6% in March, on par with the revised 1.6% increase in February.
- The U.S. labor market continues to improve. Nonfarm payrolls rose 164,000 in April. Adding revisions to the prior months’ (February and March) payrolls reports to the current month’s payrolls figure would show an increase of 194,000 jobs. The unemployment rate fell to 3.9% in April. Average hourly earnings (excludes irregular bonuses/commissions and fringe benefits) rose 0.1% in April and are up 2.6% versus a year ago. The average workweek in April was unchanged at 34.5 hours. The labor force participation rate was 62.8% in April, versus 62.9% in March.
On The Other Hand
- Manufacturing activity continued to grow but at a slightly slower pace than in March. The ISM Manufacturing Index declined to 57.3 in April, down from its 59.3 level in March.
- Construction spending declined 1.7% in March. A slowdown in home building and commercial facilities more than offset a pickup in spending on highways and streets. On a positive note, March spending would have been up 0.9% if upward revisions to prior months had been included.
- U.S. light vehicle sales were at a seasonally adjusted annual rate of 17.15 million units in April versus 17.48 million units in March. The April rate was 0.7% above the 17.04 million units for April 2017. Total domestic sales decreased to 13.17 million from 13.74 million units in March.
- The ISM non-manufacturing index declined to 56.8 in April, down from 58.8 in March. Behind the headline, all eighteen service sector industries reported growth in April, though at a slightly slower pace than in March.
All Else Being Equal
The Federal Reserve held interest rates unchanged following today’s meeting, but indicated it sees economic activity and inflation heating up more than previously projected. A rate hike in June looks likely. A portion of the Federal Reserve’s statement:
The Committee expects that economic conditions will evolve in a manner that will warrant further gradual increases in the federal funds rate; the federal funds rate is likely to remain, for some time, below levels that are expected to prevail in the longer run. However, the actual path of the federal funds rate will depend on the economic outlook as informed by incoming data.
The GDPNow™ estimate for Q2 real growth continues to stand at 4.0%.
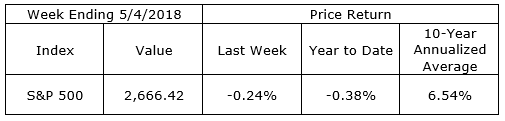
Last Week’s Market
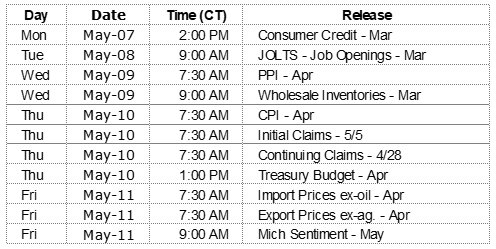
The Week Ahead
The information provided is obtained from sources believed to be reliable. Forecasts cannot be guaranteed. Past performance is not a guarantee of future results.