We expand step #5 this week with some brief comments on risk.
- Establish financial objectives and determine the time frame associated with each one.
- Determine the amount of savings which will be necessary to fund the investment accounts sufficiently.
- Determine the types of investment accounts available to best take advantage of provisions in the tax code.
- Identify investment classes and determine the realistic expected returns each might generate over the spans of time associated with each objective.
- Identify the risks involved with investing in each of the available asset classes.
- Total risk is the sum of specific risk and systematic risk. Specific risk is that which applies to individual or specific securities, companies or industries. Specific risk may arise due to factors such as business risk, product liability risk, regulatory risk and financial risk. Proper diversification can virtually eliminate specific risk. Systematic risk is more a more difficult obstacle.
- Systematic risk, also called market risk, cannot be eliminated through diversification. Systematic risks are those that affect the entire market. Factors such as recession, inflation, changes in the level of interest rates, political turmoil and other macro risks will affect the direction and volatility of the broad markets. While systematic risk can be mitigated to some degree by asset allocation, it can never be eliminated.
- Although the U.S. Treasury’s debt was downgraded to AA+ from AAA by Standard & Poor’s in 2011, Moody’s and Fitch continue to rate it AAA and 90-day Treasury bills are deemed to provide a risk-free rate of return. While risk-free in the short-term, a portfolio of 90-day Treasury bills with interest and principal guaranteed by the U.S. Treasury, are exposed to the significant risk of the loss of purchasing power. Today, the rate of return on a 90-day T-bill is 1.87% which is 1.00% below the 2.87% rate of inflation. Compounding these rates over ten years results using a beginning portfolio of $100,000 results in a portfolio of $120,355 but the cost of the original basket of goods and services will rise to $132,705, a 9% loss of purchasing power of the period.
- Another risk investors should be aware of is emotional and psychological risk. Human beings have a natural tendency swing emotionally from euphoria to fear. When returns have been high and background news (or noise) is good, people tend to maximize financial risk – buy when prices are high. Then, when prices decline, and the news turns negative they get defensive and move to eliminate risk – sell after prices have gone down. Consumers normally slow or cease purchases when prices rise. When prices fall, consumers tend to increase purchases when products and services go on sale. The paradox in financial decision making, buying when prices are high and selling when prices are low, is due to emotional reaction overwhelming thoughtful analysis, causing investors to make disastrous financial decisions. Investors need to understand this risk and carefully asses their ability to remain unemotional when making personal financial decisions.
- Unfortunately, financial product salespeople learn to take advantage of the various types of risk especially the risk from stress generated by emotion. A fiduciary advisor does not sell financial products. A fiduciary is paid to educate and help guard against undue financial and behavioral risk. The investor’s sole best interest is the primary guideline.
- Determine when cash outflows need to begin and from which type of account it should be withdrawn.
On The One Hand
- Housing starts increased 5.0% in May to a 1.350 million annual rate. Starts are up 20.3% versus a year ago. The gain in starts in May was due to both single-family and multi-unit starts. In the past year, single-family starts are up 18.3% while multi-unit starts are up 25.1%.
- Initial unemployment claims for the week decreased by 3,000 to 218,000. The four-week moving average for initial claims decreased by 4,000 to 221,000. Continuing claims for the week increased by 22,000 to 1.723 million. The four-week moving average for continuing claims decreased by 4,750 to 1,722,500, which is the lowest level since December 8, 1973. Initial claims have held below 300,000 for 172 straight weeks.
- The Leading Economic Index increased 0.2% in May. The month also saw increases in the Coincident Economic Index, up 0.2% and the Lagging Economic Index, up 0.5%.
On The Other Hand
- New building permits declined 4.6% in May to a 1.301 million annual rate. Compared to a year ago, permits for single-family units are up 7.7% while permits for multifamily homes are up 8.6%.
- Existing home sales declined 0.4% in May to a 5.43 million annual rate. Sales of existing homes are down 3.0% versus a year ago.
- The Philadelphia Fed Index for June came in at 19.9 which is a sharp decline from the 34.4 posted for May. On the bright side, a number above 0.0, is a sign of expansion. Behind the downturn was a dive in the New Orders Index which dropped to 17.9 from 36.4 and a decline in the Unfilled Orders Index which dropped to -2.7 from 15.3.
All Else Being Equal
The Atlanta Fed’s GDPNow estimate for real Q2 GDP growth is 4.7%.
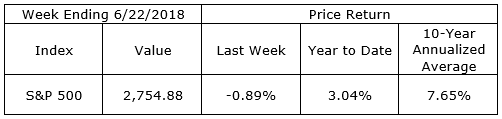
Last Week’s Market
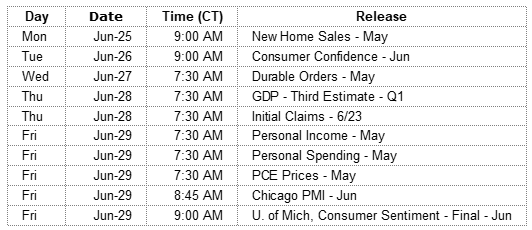
The Week Ahead
The information provided is obtained from sources believed to be reliable. Forecasts cannot be guaranteed. Past performance is not a guarantee of future results.