Stocks lost ground for the week, just the second week in the last ten to close lower. Declines in technology stocks and trade fears lead the indexes to lower. Fixed income yields rose on positive economic data. These mildly interesting facts should mean little to investors, who are intent on executing their plans for decades of accumulation of assets, with which they will support their families in decades of retirement.
This week will mark the ten-year anniversary of the collapse of Lehman Brothers, an event most consider to be the beginning of the end of the worst financial crisis since the Great Depression. Today is a good time to reflect on the value of “time in the market” rather than “timing the market.” Consider an investor with the worst possible timing, investing $100,000 in the S&P 500 index on October 9, 2007, an all-time high for the index at the time and 11 months before the looming Lehman bankruptcy. Wiped out? Not if that investor believed in the value of “time in the market.” Today, with dividends reinvested, that investment would be up 132% or an average of 8% per year.
As we all know, that time in the market, from October 9, 2007 through last Friday’s close, was not always pleasant. In fact, at the end of the first 17 months the investment would have been down 45%. Our unlucky investor’s time in the market was filled with weekly, quarterly, and annual bouts of bad news and market price disappointments but, although there were and never will be guarantees, in the end “time in the market” did again pay off.
On The One Hand
- The ISM Manufacturing Index rose to 61.3 in August, beating the consensus expected 57.6 and signaling continued expansion.
- Construction spending increased 0.1% in July and revisions to prior months improved by 0.3%. Construction spending is up 5.8% in the past year.
- The trade deficit widened to $50.1 billion in July, but the more important total trade figure rose 0.04% to an all-time high of $472.3 billion.
- Initial unemployment claims declined by 10,000 to 203,000 putting the four-week moving average for initial claims at 209,500, the lowest levels for both figures since December 6, 1969. Continuing claims were down 3,000 to 1.707 million.
- The ISM non-manufacturing index rose to 58.5 in August.
- The volatile nonfarm payrolls figure was reported as an increase of 201,000 in August but the July figure was revised downward by 17,000 to 153,000 and June was reduced by 42,000 to 192,000. The unemployment rate held at 3.9% and the broader, U-6 unemployment rate, which includes discouraged and marginally-attached workers, as well as those working part-time who state they want full-time jobs, fell to 7.4% in August, the lowest level since 2001. The surprise in the August employment report was the 0.4% increase in average hourly earnings which lifted the year-over-year increase to 2.9%.
On The Other Hand
Factory orders dropped 0.8% in July and the June figure was adjusted down by 0.1% to an increase of 0.6%. Excluding transportation, orders rose 0.4% in both July and June.
All Else Being Equal
The current week’s inflation data, the Producer Price Index and the Consumer Price Index, will be used to handicap the likelihood of a Fed rate increase on the 26th of this month. There is currently little doubt the fed funds rate will be raised by one-quarter percent to a new range of 2.00% to 2.25%.
The Atlanta Fed GDPNow forecast rose to 4.4% and the New York Fed Nowcast for our current quarter’s real GDP growth rate rose to 2.2% during last week.
Last Week’s Market

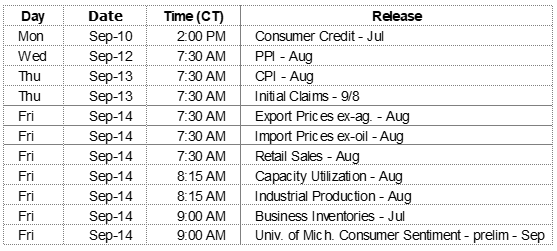
The Week Ahead
The information provided is obtained from sources believed to be reliable. Forecasts cannot be guaranteed. Past performance is not a guarantee of future results.