Despite the ongoing battle against the coronavirus, stocks reached record highs last week. Solid economic data, strong retail sales, and favorable corporate earnings reports helped quell investors’ fears that the spread of the dreaded coronavirus would impact global economies. Each of the benchmark indexes listed here posted weekly gains, led by the Nasdaq, which advanced 2.21%, followed by an almost 2.0% bump in the small caps of the Russell 2000. Both large-cap indexes climbed higher, with the S&P 500 gaining 1.58% and the Dow pushing just past 1.0%.
Oil prices inched higher last week, closing at $52.09 per barrel by late Friday afternoon, up slightly from the prior week’s price of $50.47. The price of gold (COMEX) recovered last week, closing at $1,587.20 by late Friday afternoon, up from the prior week’s price of $1,573.90. The national average retail regular gasoline price was $2.419 per gallon on February 10, 2020, $0.036 lower than the prior week’s price but $0.143 more than a year ago.
Last Week’s Economic News
- Consumer prices inched up 0.1% in January following a 0.2% bump in December. Falling energy prices pulled the Consumer Price Index down. Over the last 12 months, the CPI has increased 2.5% — the largest 12-month increase since the period ending October 2018. The index for all items less food and energy rose 0.2% in January after increasing 0.1% in December.
- Retail sales jumped 0.3% in January after inching ahead 0.1% the prior month. Retail sales climbed 4.4% since January 2019. Nonstore (online) retail sales jumped 0.3% in January and are 8.4% over January 2019.
- Import prices were unchanged in January following a 0.2% increase in both December and November. Falling fuel prices offset increasing prices for nonfuel imports. Export prices advanced 0.7% last month after falling 0.2% in December. This is the largest monthly advance since the index increased 0.7% in March. For 2019, import prices increased 0.3% while export prices rose 0.5%.
- Industrial production declined 0.3% in January, as unseasonably warm weather held down the output of utilities, and a major manufacturer significantly slowed production of civilian aircraft. Industrial production was 0.8% lower in January than it was a year earlier. The index for manufacturing edged down 0.1% in January; excluding the production of aircraft and parts, factory output advanced 0.3%. The index for mining rose 1.2%.
- The number of job openings fell to 6.4 million (-364,000) on the last business day of December, according to the U.S. Bureau of Labor Statistics Job Openings and Labor Turnover report. Over 2019, the job openings level declined by 14.9%. The number of hires was little changed at 5.9 million in December. The hires rate was little changed at 3.9%. Total separations includes quits, layoffs and discharges, and other separations. Total separations is referred to as turnover. In December, the number of total separations was little changed at 5.7 million and the rate was little changed at 3.8%. Over the 12 months ended in December, hires totaled 70.0 million and separations totaled 67.8 million, yielding a net employment gain of 2.2 million.
- The government budget deficit was $32.6 billion in January — $41.3 billion higher than the budget surplus from the prior January. Year-to-date the deficit sits at $389.2 billion, 25.0% above the deficit over the same period last year. Through the first four months of the fiscal year, government expenditures are up 10.3% over expenditures during the same period last fiscal year, while government receipts are down 6.1%.
- For the week ended February 8, there were 205,000 claims for unemployment insurance, an increase of 2,000 from the previous week’s level, which was revised up by 1,000. According to the Department of Labor, the advance rate for insured unemployment claims remained at 1.2% for the week ended February 1. The advance number of those receiving unemployment insurance benefits during the week ended February 1 was 1,698,000, a decrease of 61,000 from the prior week’s level, which was revised up by 8,000.
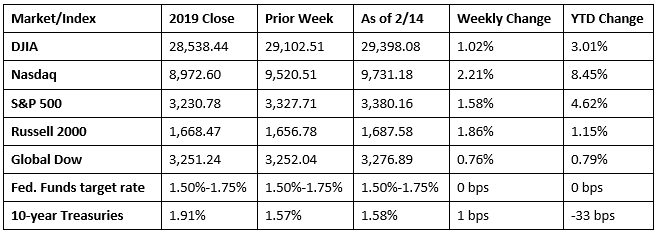
Chart reflects price changes, not total return. Because it does not include dividends or splits, it should not be used to benchmark performance of specific investments.
Eye on the Week Ahead
The residential sector is front and center this week with January’s figures on new home construction and existing home sales. Producer prices for January are also available this week. December saw producer prices inch up 0.1%. In 2019, prices at the producer level moved up 1.3%.
The Week Ahead

The information provided is obtained from sources believed to be reliable. Forecasts cannot be guaranteed. Past performance is not a guarantee of future results.