Stocks surged early last Monday only to fall back by the end of the day. Earlier in the day, the S&P 500 reached its highest level since the COVID-19 pandemic sent equities reeling. The Nasdaq hit another record high in early trading. Unfortunately, stocks couldn’t hold their values as states hard-hit by growing numbers of reported virus cases began to rein in reopening measures. European stocks climbed last Monday as did Treasury bond yields. Crude oil prices dipped ahead of an OPEC meeting that could result in plans to ease production cuts.
Equities rebounded last Tuesday as the Dow rose 2.1%, the S&P 500 climbed 1.3%, the Nasdaq advanced 0.9%, and the Russell 2000 gained 1.76%. Treasury yields slid 3.91% while crude oil prices jumped 0.85%. Market sectors advancing last Tuesday included energy, materials, industrials, and consumer staples.
Optimism about progress on a COVID-19 vaccine spurred investors last Wednesday. By the end of the day, the Russell 2000 jumped 3.5%, followed by the Global Dow, which advanced 1.3%. The S&P 500 gained 0.9%, the Dow increased 0.85%, and the Nasdaq rose 0.6%. Crude oil and Treasury yields grew while the dollar fell. Banks led financial stocks higher, and energy stocks also climbed.
A drop in technology shares pulled stocks lower last Thursday, ending a two-day rally. The Nasdaq fell 0.7% as Microsoft, Amazon, and Apple Inc. lost value. The Dow dropped 0.5%, the S&P 500 sank 0.3%, and the Russell 2000 fell 0.7%. Treasury yields declined 2.9%, and crude oil prices decreased 1.2%.
Stocks were mixed last Friday as the S&P 500 and the Nasdaq posted modest gains while the Dow fell for the second consecutive day. Within the S&P 500, the health-care sector soared to a record high. Other sectors advancing last Friday included utilities, real estate, and materials, while financials and energy lagged.
For the week, only the Nasdaq failed to post a gain while each of the other indexes listed here advanced. The S&P 500 gained 1.25% and is less than 0.2 percentage point from its 2019 closing value. For the week, the Russell 2000 led the way, climbing 3.56%, followed by the Dow, which rose nearly 2.30%. The Nasdaq, despite losing a little more than 1.0%, is still more than 17.0% ahead of its 2019 ending mark. Treasury yields ended last week about where they started, while crude oil and gold each closed the week ahead.
Crude oil prices ended the week at $40.58 per barrel by late Friday afternoon, up from the prior week’s price of $40.32. The price of gold (COMEX) advanced for the fifth consecutive week, closing at $1,812.20, up from the prior week’s price of $1,801.40. The national average retail price for regular gasoline was $2.195 per gallon on July 13, $0.018 higher than the prior week’s price but $0.584 less than a year ago.
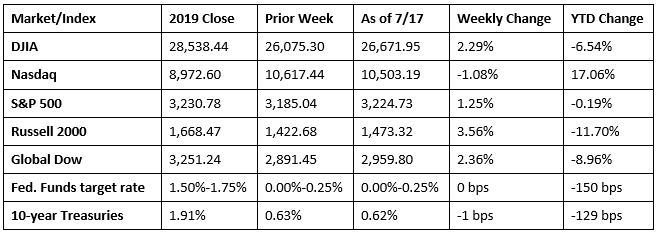
Chart reflects price changes, not total return. Because it does not include dividends or splits, it should not be used to benchmark performance of specific investments.
Last Week’s Economic News
- Consumer prices rose 0.6% in June after falling 0.1% in May. Over the last 12 months, consumer prices increased 0.6%. Gasoline prices rose sharply in June, jumping 12.3% after plunging 20.6% in April and 3.5% in May. For the 12 months ended in June, energy prices are down 12.6%. Food prices increased 0.6% last month and have risen each month since last December. Consumer prices less food and energy increased 0.2% in June and are up 1.2% over the past 12 months.
- Retail sales jumped 7.5% in June, driven higher by a 105.1% advance in retail sales at clothing and clothing accessories stores. Also enjoying a strong June were sales at electronics and appliance stores and furniture and home furnishing stores. Sales at food services and drinking places climbed 20.0% in June after falling 26.3% in May. Online sales fell 2.4% last month after soaring 23.5% in May.
- June saw the federal budget deficit soar to $864.1 billion as June spending surpassed $1.1 trillion. The deficit last June was $8.5 billion. Through the first nine months of the fiscal year, the deficit sits at $2.74 trillion — an increase of 267% from the same period last fiscal year. A $511.4 billion jump in June outlays by the Small Business Administration, primarily for the Paycheck Protection Program, pushed overall monthly spending higher.
- Import prices rose 1.4% in June after advancing 0.8% the previous month. The June increase was the highest since March 2012. A record 21.9% monthly increase in fuel prices drove overall import prices higher. Excluding fuel, import prices rose 0.3% in June. Despite the last two monthly increases, import prices fell 3.8% for the 12 months ended in June. Export prices climbed 1.4% in June, the largest monthly increase since March 2011. Over the last 12 months ended in June, export prices decreased 4.4%.
- According to the latest information from the Federal Reserve, total industrial production rose 5.4% in June after increasing 1.4% in May. Even so, industrial production remained 10.9% below its pre-pandemic February level. For the second quarter as a whole, industrial production fell at an annual rate of 42.6%, its largest quarterly decrease since the industrial sector retrenched after World War II. Manufacturing output climbed 7.2% in June, driven by a 105% surge in motor vehicles and parts. Excluding motor vehicles, factory production rose 3.9%. Mining production fell 2.9%, and the output of utilities increased 4.2%. Overall, total industrial production was 10.8% lower in June than it was a year earlier.
- New residential construction picked up steam in June. Building permits (+2.1%), housing starts (+17.3%), and housing completions (+4.3%) each rose above their respective May levels. Single-family construction was even more robust last month as building permits, housing starts, and housing completions of single-family homes were significantly higher than in May.
- For the week ended July 11, there were 1,300,000 claims for unemployment insurance, a decrease of 10,000 from the previous week’s level, which was revised down by 4,000. According to the Department of Labor, the advance rate for insured unemployment claims was 11.9% for the week ended July 4, a decrease of 0.3 percentage point from the prior week’s revised rate. The advance number of those receiving unemployment insurance benefits during the week ended July 4 was 17,338,000, a decrease of 422,000 from the prior week’s level, which was revised down by 302,000.
Eye on the Week Ahead
The housing market is front and center this week with the latest reports on sales of both existing and new homes. Sales of existing homes are expected to rebound in June from May’s nearly 10% decline. On the other hand, new home sales soared in May and could retreat in June.
The Week Ahead

The information provided is obtained from sources believed to be reliable. Forecasts cannot be guaranteed. Past performance is not a guarantee of future results.