Stocks began last week mostly lower, pulled down by tech and consumer shares. Of the benchmark indexes listed here, only the Russell 2000 (0.1%) and the Global Dow (0.2%) were able to eke out gains. The Nasdaq dipped 0.4%, followed by the S&P 500, which lost 0.3%, and the Dow, which fell 0.2%. Treasury yields rose modestly, while crude oil prices rose 1.5%. The dollar was mixed to lower. Energy prices advanced 2.3% and materials climbed 0.9%. Tech shares dropped 0.7%, communication services declined 0.9%, and utilities fell 0.9%.
Stocks fell for the second consecutive day last Tuesday. The S&P 500 fell 0.9%, followed by the Dow, (-0.8%), the Russell 2000 (-0.7%), and the Nasdaq (-0.6%). The Global Dow inched ahead 0.1%. The yield on 10-year Treasuries was little changed, while crude oil prices and the dollar declined. The market sectors fared poorly, with energy (-2.6%), industrials (-1.5%), financials (-1.4%), communication services (-1.2%), and materials (-1.1%) the hardest hit.
Last Wednesday saw equities fall for the third consecutive day. Energy shares continued to decline, falling 2.5%. Among the remaining sectors, only information technology (0.3%) and communication services (0.1%) advanced. The Global Dow fell 1.3%, followed by the Russell 2000 (-0.8%), the Dow (-0.5%), and the S&P 500 (-0.3%). The tech-heavy Nasdaq closed the day effectively unchanged. Crude oil prices dropped for the second day in a row, while the dollar and Treasury yields rose.
Growth and tech stocks reversed course last Thursday, following three consecutive days of losses. Treasury yields, crude oil prices, and the dollar fell, while the major stock indexes gained, led by the Nasdaq, which advanced 1.8%. The S&P 500 climbed 1.1%, both the Russell 2000 and the Dow gained 0.6%, and the Global Dow added 0.4%. Among the market sectors, information technology (1.9%), communication services (1.7%), real estate (1.3%), and health care (1.0%) increased by at least 1.0%, while energy dipped 0.1%.
Crude oil prices rose for the first time in four sessions last Friday, a day in which stocks were mixed. Tech shares fell, dragging the Nasdaq down following the prior day’s rally. The S&P 500 also closed the day lower, while the Dow (0.4%) and the Russell 2000 (0.3%) advanced. Treasury yields were mixed and the dollar rose. Friday also saw the market sectors offer mixed returns, with financials, utilities, industrials, materials, and energy advancing, while communication services, consumer discretionary, consumer staples, health care, information technology, and real estate declined.
Stocks closed the week generally lower, with only the Nasdaq eking out a gain, in what proved to be a volatile week of trading. The Dow dropped 0.5%, followed by the S&P 500, the Russell 2000, and the Global Dow. The yield on 10-year Treasuries closed unchanged from the prior week. The dollar and crude oil prices fell, while the price of gold rose by 2.0%. Inflation fears, cryptocurrency volatility, and concerns that the Fed could tighten monetary policy appear to be driving much of the market lately. Despite this movement, the benchmark indexes remain well ahead of their respective prior-year values, led by the Global Dow, the Russell 2000, the Dow, the S&P 500, and the Nasdaq. Since the beginning of the year, crude oil prices are up more than 31.0%, which has driven gas prices up by more than $1.00 per gallon.
The national average retail price for regular gasoline was $3.028 per gallon on May 17, $0.067 per gallon more than the prior week’s price and $1.150 higher than a year ago. U.S. crude oil refinery inputs averaged 15.1 million barrels per day during the week ended May 14, which was 96,000 barrels per day more than the previous week’s average. Refineries operated at 86.3% of their operable capacity last week. Gasoline production increased last week, averaging 9.8 million barrels per day, up from the prior week’s average of 9.6 million barrels per day.
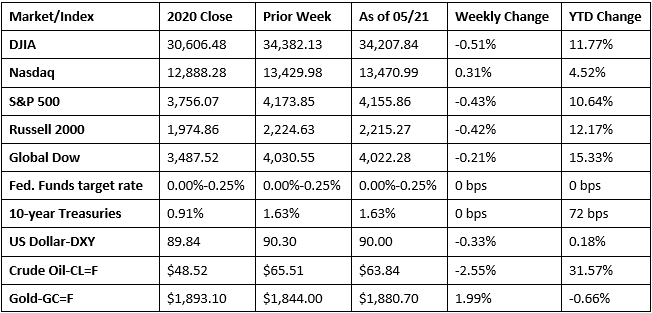
Chart reflects price changes, not total return. Because it does not include dividends or splits, it should not be used to benchmark performance of specific investments.
Last Week’s Economic News
- The number of building permits issued in April increased by 0.3%, according to the latest information from the Census Bureau. Building permits rose 8.4% in the northeast and 3.9% in the south. Issued building permits fell in the west and the midwest. Building permits for single-family housing decreased 3.8% in April. Housing starts fell 9.5% last month, and housing completions dipped 4.4%.
- Sales of existing homes fell for the third consecutive month, dipping 2.7% in April. Year over year, sales of existing homes are up 33.9%. According to the National Association of Realtors®, the supply of existing homes for sale has not kept pace with the demand, although inventory is expected to increase as further COVID-19 vaccinations are administered and potential home sellers become more comfortable listing and showing their homes. The median existing-home price for all housing types in April was $341,600, a notable increase from the March price of $329,100 and 19.1% over the April 2020 median price of $286,800. Inventory rose 10.5% in April from March, but is down 20.5% from a year ago. Unsold inventory sits at a 2.4-month supply at the current sales pace. Sales of existing single-family homes fell 3.2% in April from the prior month, but are up 28.9% from a year ago. The median existing single-family home price was $347,400 in April, 3.9% over the March price ($334,500) and 20.3% above the April 2020 price.
- For the week ended May 15, there were 444,000 new claims for unemployment insurance, a decrease of 34,000 from the previous week’s level, which was revised up by 9,000. This is the lowest level for initial claims since March 14, 2020, when it was 256,000. According to the Department of Labor, the advance rate for insured unemployment claims was 2.7% for the week ended May 8, an increase of 0.1 percentage point from the previous week’s revised rate. The advance number of those receiving unemployment insurance benefits during the week ended May 8 was 3,751,000, an increase of 111,000 from the prior week’s level, which was revised down by 15,000. For comparison, during the same period last year, there were 2,149,000 initial claims for unemployment insurance, and the insured unemployment claims rate was 15.9%. During the last week of February 2020 (pre-pandemic), there were 219,000 initial claims for unemployment insurance, and the number of those receiving unemployment insurance benefits was 1,724,000. States and territories with the highest insured unemployment rates in the week ended May 1 were in Nevada (6.1%), Connecticut (4.6%), Puerto Rico (4.6%), Alaska (4.3%), Rhode Island (4.3%), Vermont (4.3%), New York (4.1%), Pennsylvania (4.0%), the Virgin Islands (4.0%), and Illinois (3.9%). The largest increases in initial claims for the week ended May 8 were in Georgia (+7,404), Washington (+6,111), Illinois (+3,221), Pennsylvania (+2,156), and Ohio (+1,371), while the largest decreases were in Michigan (-13,990), New York (-8,106), Vermont (-5,835), Nevada (-2,835), and Florida (-2,210).
Eye on the Week Ahead
The second estimate of the first-quarter gross domestic product is out this week. According to the first estimate, the economy accelerated at a rate of 6.4%. The next two estimates will be based on more economic data, although the annual rate of growth isn’t expected to change much from the first iteration. Another important report out this week is the personal income and outlays estimate. The Federal Reserve pays particular attention to the price index as an indication of inflationary trends. The personal consumption expenditures price index increased 0.5% in April and is up 2.3% year over year.
The Week Ahead

The information provided is obtained from sources believed to be reliable. Forecasts cannot be guaranteed. Past performance is not a guarantee of future results.
© 2021 Broadridge Financial Solutions, Inc. All Rights Reserved.