Investors rode a bumpy ride, opening last week lower only to rebound later but not enough to avoid a third consecutive weekly dip. Only the Nasdaq was able to avoid closing the week in the red, but barely. The Dow and the Global Dow fell nearly 1.0%, while the S&P 500 and the Russell 2000 declined more than 0.8%. Traders were able to overcome concerns early in the week of the possible financial collapse of a major Chinese property developer, only to learn last Friday that Chinese regulators will now consider crypto-related transactions illicit financial activity.
Wall Street suffered its worst day in nearly four months last Monday. Each of the benchmark indexes listed here fell, led by the Russell 2000 (-2.4%), followed by the Nasdaq (-2.2%), the Dow (-1.8%), the S&P 500 (-1.7%), and the Global Dow (-1.7%). Prices on 10-year Treasuries climbed, driving yields down by 4.5%. The dollar was mixed, while crude oil prices fell 1.6%. Each of the market sectors declined, with energy (-3.0%), consumer discretionary (-2.4%), and financials (-2.2%) falling the most. Investors were concerned about the impact on global financial markets from the possible collapse of Evergrande.
Stocks closed mixed last Tuesday, with the Nasdaq and Russell 2000 edging 0.2% higher, while the Dow and the S&P 500 ticked lower. Crude oil prices and Treasury yields rose, while the dollar was unchanged. Industrials and communication services were sectors that weighed down stocks, while energy and health care climbed higher.
Equities rebounded last Wednesday, as the Dow, the S&P 500, and the Nasdaq each rose by at least 1.0%. The Russell 2000 led the indexes, gaining 1.5%, while the Global Dow advanced 0.8%. Ten-year Treasury yields, the dollar, and crude oil prices each ticked higher. Among the market sectors, energy, financials, information technology, and consumer discretionary advanced. Investors may have been encouraged by potentially favorable developments involving Evergrande. Also, the Federal Open Market Committee was guardedly bullish on the growth of the economy, indicating that a tapering of its asset purchases may begin soon but that interest rates would remain at their current level for quite some time.
Wall Street continued to rally last Thursday. Investors were buoyed by the Fed’s stance on paring stimulus, the Food and Drug Administration’s authorization of a Pfizer booster vaccine for those age 65 and older, and an easing of concerns over the ripple effect of an Evergrande default. Each of the benchmark indexes listed here posted gains of at least 1.0%, with the Russell 2000 again leading the pack after advancing 1.5%. The dollar and crude oil prices fell, while yields on 10-year Treasuries ticked higher. Several of the market sectors also climbed higher, led by energy (3.4%) and financials (2.5%).
Friday ended the week with mixed results. The large caps of the Dow (1.0%) and the S&P 500 (1.0%) closed higher. The Global Dow also advanced 0.8%. The tech stocks of the Nasdaq dipped less than 0.1 percentage point, while the small caps of the Russell 2000 fell 0.5%. Ten-year Treasury yields and the dollar advanced, while crude oil prices edged lower. The market sectors also closed mixed last Friday. Energy, financials, and communication services climbed higher. Real estate, materials, health care, and utilities declined.
The national average retail price for regular gasoline was $3.184 per gallon on September 20, $0.019 per gallon more than the prior week’s price and $1.016 higher than a year ago. Gasoline production increased during the week ended September 17, averaging 9.6 million barrels per day. U.S. crude oil refinery inputs averaged 15.3 million barrels per day during the week ended September 17 — 1.0 million barrels per day more than the previous week’s average. Refineries operated at 87.5% of their operable capacity, up from the prior week’s level of 82.1%.
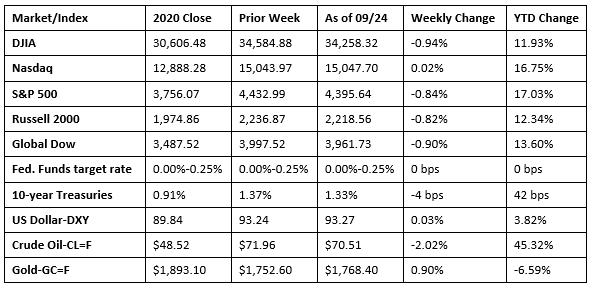
Chart reflects price changes, not total return. Because it does not include dividends or splits, it should not be used to benchmark performance of specific investments.
Last Week’s Economic News
- Following its meeting earlier in the week, the Federal Open Market Committee decided to maintain the target range for the federal funds rate at its current 0.00%-0.25%. The Committee also agreed to continue to increase its holdings of Treasury securities and agency mortgage-backed securities. The FOMC noted that the economy has made progress toward the Committee’s goals of maximum employment and price stability. If progress continues, a moderation in the pace of asset purchases may soon be warranted. However, the FOMC did not indicate when it would begin to slow the pace of asset purchases, instead proffering that it would adjust the stance of monetary policy as appropriate if risks emerge that could impede the attainment of the Committee’s aforementioned goals. Following the Committee’s statement, FOMC Chairman Jerome Powell said that the Fed could wrap up its asset purchase program before the end of 2022 as long as the economic recovery remains on track.
- New home construction picked up the pace in August. The number of building permits increased 6.0% from the July rate and are 13.5% above the August 2020 pace. Housing starts rose 3.9% in August, while housing completions dipped 4.5%. However, single-family housing completions advanced 2.8% last month.
- Existing home sales retreated 2.0% in August, following two consecutive monthly increases. Sales are down 1.5% from August 2020. Rising existing home prices may have caused potential buyers to be more measured about their financial limits, prompting a slowdown in the pace of sales. The median existing-home price in August was $356,700, down from $359,900 in July. However, home prices have increased 14.9% since August 2020. Unsold inventory sat at a 2.6-month supply in August, unchanged from July. Single-family existing-home sales fell 1.9% in August and are down 2.8% from a year ago. The median existing single-family home price was $363,800 in August ($367,000 in July), up 15.6% from August 2020.
- Sales of new single-family houses in August were 1.5% above the July rate, but 24.3% below the August 2020 pace. The median sales price of new houses sold in August was $390,900, unchanged from July. The average sales price was $443,200, down from $448,700 in July. The estimate of new houses for sale at the end of August represents a supply of 6.1 months at the current sales rate.
- Industrial production rose 0.4% in August after climbing 0.8% the previous month. Late-month shutdowns related to Hurricane Ida held down the gain in industrial production by an estimated 0.3 percentage point. Despite interruptions caused by the hurricane, manufacturing output increased 0.2%. Hurricane Ida impacted mining production, which fell 0.6%. Utilities increased 3.3%, as unseasonably warm temperatures boosted demand for air conditioning.
- For the week ended September 18, there were 351,000 new claims for unemployment insurance, an increase of 16,000 from the previous week’s level, which was revised up by 3,000. According to the Department of Labor, the advance rate for insured unemployment claims for the week ended September 11 was 2.1%, an increase of 0.1 percentage point from the previous week’s rate, which was revised up by 0.1 percentage point. The advance number of those receiving unemployment insurance benefits during the week ended September 11 was 2,845,000, an increase of 131,000 from the prior week’s level, which was revised up by 49,000. For comparison, last year at this time, there were 860,000 initial claims for unemployment insurance and the rate for unemployment claims was 8.7%. During the last week of February 2020 (pre-pandemic), there were 219,000 initial claims for unemployment insurance, and the number of those receiving unemployment insurance benefits was 1,724,000. States and territories with the highest insured unemployment rates for the week ended September 4 were Puerto Rico (4.4%), the District of Columbia (4.2%), California (3.1%), New Jersey (3.0%), Nevada (2.8%), New York (2.8%), Rhode Island (2.7%), Hawaii (2.5%), and Connecticut (2.2%). States and territories with the largest increases in initial claims for the week ended September 11 were Louisiana (+4,318), the District of Columbia (+3,783), Arizona (+3,739), Maryland (+2,018), and Missouri (+1,658), while the largest decreases were in Illinois (-7,481), California (-5,950), Ohio (-4,665), Texas (-3,635), and Virginia (-2,357).
Eye on the Week Ahead
There’s plenty of important economic data available the last week of September. Orders for durable goods slipped in July but are expected to rebound in August. The third and final estimate of second-quarter gross domestic product is also out this week. The economy expanded at an annualized rate of 6.6%, according to the second estimate.
The Week Ahead

The information provided is obtained from sources believed to be reliable. Forecasts cannot be guaranteed. Past performance is not a guarantee of future results.
© 2021 Broadridge Financial Solutions, Inc. All Rights Reserved.