The first week of November saw stocks climb higher on the strength of favorable corporate earnings data, strong job growth, a dovish policy statement from the Federal Reserve, and favorable news on the battle against COVID-19. Several of the benchmark indexes listed here reached record highs. The Russell 2000 led the indexes for the week, followed by the Nasdaq, the S&P 500, the Global Dow, and the Dow. Ten-year Treasury yields dipped for the second consecutive week. The dollar inched higher, while crude oil prices fell. Several of the market sectors trended higher, led by consumer discretionary (5.0%), information technology (3.3%), and materials (3.2%).
Energy and consumer discretionary stocks helped drive the S&P 500 to another record high last Monday. Third-quarter corporate earnings data has continued to be strong, with results of more than 80% of the reporting companies in the S&P 500 exceeding estimates. Stocks have generally rallied since earnings season began a few weeks ago, despite ongoing and persistent supply-chain bottlenecks that have weighed on manufacturers. Also posting gains were the small caps of the Russell 2000 (2.7%), the Global Dow (1.0%), the Nasdaq (0.6%), and the Dow (0.3%). Treasury yields were flat, the dollar fell, and crude oil prices increased.
Last Tuesday, the Dow (0.4%) closed above 36,000 for the first time ever, while the S&P 500 (0.4%) and the Nasdaq (0.3%) also reached record highs. The Russell 2000 rose 0.2%, while the Global Dow dropped 0.2%. Ten-year Treasury yields fell to 1.54%. The dollar climbed higher, while crude oil prices declined. The best performing market sectors were materials, real estate, information technology, consumer staples, and health care.
Wall Street continued to trend higher last Wednesday after the Federal Reserve’s policy announcement matched expectations. The Russell 2000 gained 1.8%, followed by the Nasdaq (1.0%), the S&P 500 (0.7%), the Global Dow (0.4%), and the Dow (0.3%). With Wednesday’s gains, the S&P 500, the Dow, the Nasdaq, and the Russell 2000 each closed at record highs, a feat not seen since the beginning of 2018. The market sectors generally performed well, with only energy (-0.8%) and utilities (-0.3%) falling. Consumer discretionary (1.8%) and materials (1.1%) gained the most. Bond prices fell, pushing yields higher. The dollar and crude oil prices declined.
The Nasdaq and the S&P 500 rose to new all time highs last Thursday, while the Dow, the Russell 2000, and the Global Dow slipped lower. Ten-year Treasury yields fell to 1.52%. The dollar rose, while crude oil prices fell below $80.00 to $79.21 per barrel. The market sectors were mixed, with consumer discretionary and information technology advancing 1.5%, while financials and real estate dipped more than 1.0%.
Stocks closed last week on a high note, with the Dow, the Russell 2000, the Nasdaq, and the S&P 500 reaching record highs. Strong jobs data and encouraging news about the viability of an antiviral pill for COVID-19 helped equities extend recent gains. The Russell 2000 advanced nearly 1.5%, followed by the Dow (0.6%), the Global Dow (0.5%), the S&P 500 (0.4%), and the Nasdaq (0.2%). Health care was the only market sector to recede. Energy jumped 1.4% to lead the gainers. Treasury yields and the dollar slid, while crude oil prices climbed back above $80.00 per barrel, closing around $81.40.
The national average retail price for regular gasoline was $3.390 per gallon on November 1, $0.007 per gallon more than the prior week’s price and $1.278 higher than a year ago. Gasoline production increased during the week ended October 29, averaging 10.2 million barrels per day. U.S. crude oil refinery inputs averaged 15.0 million barrels per day during the week ended October 29 — 25,000 barrels per day less than the previous week’s average. Refineries operated at 86.3% of their operable capacity, up from the prior week’s level of 85.1%.
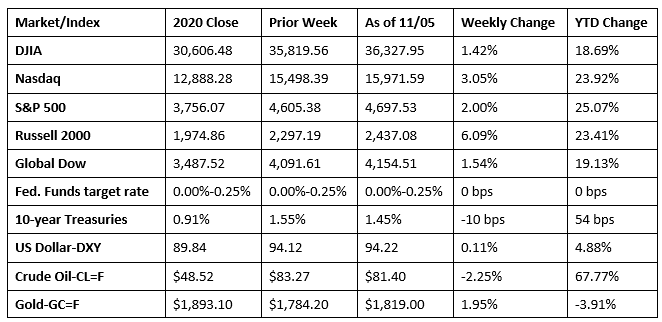
Chart reflects price changes, not total return. Because it does not include dividends or splits, it should not be used to benchmark performance of specific investments.
Last Week’s Economic News
- October saw 531,000 new jobs added, the unemployment rate dipped 0.2 percentage point to 4.6%, and the number of unemployed dropped 255,000 to 7.4 million. The number of unemployed and the unemployment rate continue to trend downward, but they remain above their levels prior to the pandemic (3.5% and 5.7 million, respectively, in February 2020). Thus far this year, monthly job growth has averaged 582,000. Employment has increased by 18.2 million since April 2020 but is down by 4.2 million, or 2.8%, from its pre-pandemic level in February 2020. Notable job gains occurred in leisure and hospitality, in professional and business services, in manufacturing, and in transportation and warehousing. Employment in public education declined over the month. The labor force participation rate in October, at 61.6%, was unchanged from the previous month. The employment-population ratio inched up 0.1 percentage point in October to 58.8%. Among the unemployed, 840,000 voluntarily left their jobs, up 52,000 from the September figure. Conversely, the number of persons not in the labor force who currently want a job was 6.0 million in October, essentially unchanged over the month but up by 968,000 since February 2020. In October, 11.6% of employed persons teleworked because of the pandemic, down from 13.2% in the prior month. In October, 3.8 million persons reported that they had been unable to work because their employer closed or lost business due to the pandemic, down from 5.0 million in September. Average hourly earnings increased by $0.11 to $30.96 in October. Over the past 12 months, average hourly earnings have increased 4.9%. The average workweek decreased by 0.1 hour to 34.7 hours in October.
- There were no surprises following the Federal Open Market Committee’s meeting last week. The target range for the federal funds rate will remain at its present 0.00%-0.25%. However, in light of the substantial further progress the economy has made toward the Committee’s goals since last December, the Committee decided to begin reducing the monthly pace of its net asset purchases by $10 billion for Treasury securities and $5 billion for agency mortgage-backed securities, beginning later this month.
- Capacity constraints, transportation delays, rising material costs, and labor shortages continued to impact manufacturers in October, according to the latest survey of purchasing managers from IHS Markit. The IHS Markit U.S. Manufacturing Purchasing Managers’ Index™ (PMI™) posted 58.4 in October, down from 60.7 in September. Although manufacturing increased (a reading of 50.0 and above signifies growth) in September, the PMI™ was the weakest in 10 months.
- While the manufacturing sector may be feeling the effects of supply bottlenecks, service providers enjoyed a strong October. The IHS Markit US Services PMI Business Activity Index registered 58.7 in October, up from 54.9 in September. Survey respondents noted a steep upturn in business activity in October, with the rise in output the quickest in three months. New business expanded, supported by a rise in new orders. Nonetheless, concerns regarding labor shortages and unstable supply chains led business confidence to drop to an eight-month low. The rate of cost inflation eased to an eight-month low, despite being quicker than any pace of increase since before March 2021. In response to a further rise in costs, firms raised their selling prices at the fastest rate on record.
- The September goods and services trade deficit was $80.9 billion, up $8.1 billion, or 11.2%, from the August deficit. Exports fell $6.4 billion, or 3.0%, while imports rose $1.7 billion, or 0.6%. Year to date, the goods and services deficit increased $158.7 billion, or 33.1%, from the same period in 2020. Exports increased $274.1 billion, or 17.4%. Imports increased $432.8 billion, or 21.1%.
- For the week ended October 30, there were 269,000 new claims for unemployment insurance, a decrease of 14,000 from the previous week’s level, which was revised up by 2,000. This is the lowest level for initial claims since March 14, 2020, when it was 256,000. According to the Department of Labor, the advance rate for insured unemployment claims for the week ended October 23 was 1.6%, a decrease of 0.1 percentage point from the previous week’s rate. The advance number of those receiving unemployment insurance benefits during the week ended October 23 was 2,105,000, a decrease of 134,000 from the prior week’s level, which was revised down by 4,000. This is the lowest level for insured unemployment since March 14, 2020, when it was 1,770,000. For comparison, last year at this time, there were 765,000 initial claims for unemployment insurance, and the rate for unemployment claims was 4.8%. During the last week of February 2020 (pre-pandemic), there were 219,000 initial claims for unemployment insurance, and the number of those receiving unemployment insurance benefits was 1,724,000. States and territories with the highest insured unemployment rates for the week ended October 16 were Puerto Rico (4.2%), California (2.9%), Hawaii (2.8%), Illinois (2.8%), New Jersey (2.5%), the Virgin Islands (2.5%), Alaska (2.4%), the District of Columbia (2.3%), Nevada (2.3%), and Pennsylvania (2.0%). The largest increases in initial claims for the week ended October 23 were in the District of Columbia (+3,875), Kentucky (+2,940), Missouri (+2,048), Florida (+1,307), and Oklahoma (+1,256), while the largest decreases were in California (-13,138), Georgia (-4,107), Michigan (-2,505), Pennsylvania (-1,245), and Tennessee (-794).
Eye on the Week Ahead
Inflation data for October is available this week with the release of the Producer Price Index and the Consumer Price Index. Prices at the producer level have risen at a faster pace than consumer prices. The PPI jumped 0.5% in September and is up 8.6% over the past 12 months. The CPI advanced 0.4% in September and has risen 5.4% since last September.
The Week Ahead

The information provided is obtained from sources believed to be reliable. Forecasts cannot be guaranteed. Past performance is not a guarantee of future results.
© 2021 Broadridge Financial Solutions, Inc. All Rights Reserved.