Omicron, escalating prices, and the tightening of monetary policy by central banks in the United States and around the world took center stage last week. The prospect of higher interest rates in 2022 could make it less appealing to own riskier investments. All of the stock market indexes ended the week in the red, with the tech-heavy Nasdaq taking the biggest hit. Ten-year Treasury yields fell 8 basis points, and the price of gold increased, as some investors took a more defensive stance. The dollar rose and crude oil prices fell, albeit slightly.
Worries about the fast-spreading COVID-19 variant caused U.S. stocks to fall back from a record high on Monday. The Nasdaq and the Russell 2000 led the retreat, both falling 1.4%, while the S&P 500 and the Dow fell 0.9%. The Global Dow was flat. Ten-year Treasury yields dropped to close at 1.42%, and crude oil prices declined slightly, while the dollar advanced. The market sectors were also mixed, with real estate, utilities, and consumer staples showing strength, while energy, consumer discretionary, and information technology lagged.
Stocks dropped again last Tuesday, as a larger-than-expected jump in producer prices caused investors to fret about the potential for more aggressive Fed action against inflation. The Nasdaq posted the largest loss (-1.1%), followed by the Russell 2000 (-1.0%), the S&P 500 (-0.8%), the Dow (-0.3%), and the Global Dow (-0.2%). Crude oil prices slipped after the International Energy Agency announced that the global oil market has returned to surplus due to fast-spreading Omicron and the resulting reduction in oil demand.
On Wednesday, news that a more hawkish Federal Reserve now expects to wind down stimulus and raise interest rates more rapidly than previously thought was well received by investors. Each of the benchmark indexes listed here posted gains, led by the Nasdaq, which bounced back 2.2%. The Russell 2000 gained 1.7%, followed by the S&P 500 (1.6%), the Dow (1.1%), and the Global Dow (0.3%). The 10-year Treasury yield inched up to 1.46%.
A sharp drop in the shares of large technology companies dragged the U.S. stock market lower last Thursday. The Nasdaq dropped 2.5%, marking the fourth consecutive day that prices swung more than 1% in either direction. The Russell 2000 (-2.0%), the S&P 500 (-0.9%), and the Dow (-0.1%) also fell, while the Global Dow rose (1.0%). Information technology and consumer discretionary suffered the largest declines. Despite losses in the major benchmark indexes, 8 of the market’s 11 sectors saw gains, led by financials and materials. Treasury yields ticked down, the dollar weakened, and crude oil prices rose.
Equities generally closed lower after a volatile week on Friday. The Russell 2000 stood out by posting a 1.0% gain. The Dow declined 1.5%, followed by the S&P 500 (-1.0%) and the Global Dow (-0.9%). The Nasdaq was flat. Treasury yields dipped, crude oil prices dropped, and the dollar advanced. All of the market sectors lost ground, with financials (-2.3%) and energy (-2.2%) tumbling the furthest.
The national average retail price for regular gasoline was $3.315 per gallon on December 13, $0.026 per gallon less than the prior week’s price but $1.157 higher than a year ago. Gasoline production increased during the week ended December 10, averaging 10.0 million barrels per day. U.S. crude oil refinery inputs averaged 15.7 million barrels per day during the week ended December 10 — 115,000 barrels per day less than the previous week’s average. Refineries operated at 89.8% of their operable capacity, the same level as the prior week.
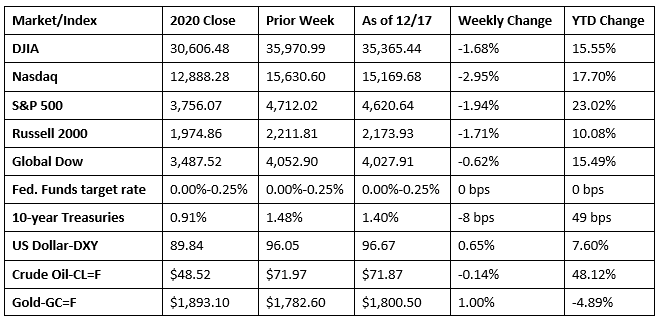
Chart reflects price changes, not total return. Because it does not include dividends or splits, it should not be used to benchmark performance of specific investments.
Last Week’s Economic News
- Producer prices advanced 0.8% in November after climbing 0.6% in each of the previous three months. Producer prices have risen 9.6% over the past 12 months ended in November, the largest 12-month increase in the history of the index (November 2010). Prices for final demand less foods, energy, and trade services increased 6.9% from the previous November, the largest advance since 12-month data was first calculated in August 2014. Prices for final demand services rose 0.7% in November, the eleventh consecutive advance, while prices for final demand goods rose 1.2%. The advances in producer prices for goods and services were broad based.
- Retail sales rose 0.3% in November after an increase of 1.8% in October, confirming that some holiday spending was pulled forward in anticipation of supply shortages and rising prices. On the whole, consumers have been willing and able to spend this year. For the 12 months ended in November, retail sales were up 18.2%, and retail trade sales were up 16.1%. Gasoline station sales increased 1.7% in November and were up 52.3% from November 2020, while food services and drinking places increased 1.0% and were 37.4% above last year.
- Import prices increased 0.7% last month following a 1.5% increase in October. Natural gas prices jumped 27.4% in November, but both higher fuel and nonfuel prices contributed to the advance. Prices for imports rose 11.7% since November 2020, the largest 12-month increase since the year ended September 2011. Overall, import fuel prices increased 86.1% over the past 12 months. Petroleum prices have risen 85.8% for the year, while natural gas prices have risen 108.7%. Prices for U.S. exports rose 1.0% in November after a 1.6% advance in October. U.S. export prices were up 18.2% since November 2020, the largest 12-month advance since the data was first published in September 1984.
- The Federal Reserve decided to keep the target range for the federal funds rate at 0%-0.25%. Inflation has exceeded 2% for some time, but the Committee expects it will be appropriate to maintain this target range until labor market conditions have reached levels consistent with the Committee’s assessments of maximum employment. In light of inflation developments and further improvement in the labor market, the Committee will reduce the monthly pace of its net asset purchases by $20 billion for Treasury securities and $10 billion for agency mortgage-backed securities. Published projections showed that Fed officials believe economic conditions will call for three rate increases in 2022.
- The number of building permits for new residential construction rose 3.6% in November. Building permits for single-family construction increased 2.7%. Overall, the number of building permits issued for residential construction is 0.9% above the November 2020 rate. Housing starts surged 11.8% last month, along with single-family housing starts (11.3%). Housing completions rose 4.1% in November from the previous month and were 3.1% above the November 2020 pace. Single-family home completions were essentially unchanged.
- Industrial production rose 0.5% in November after rising 1.7% in October. For the industrial sector as a whole, non-energy production advanced 0.9%, while the output of energy goods fell 0.4%. Manufacturing output rose 0.7% last month, led by a 2.2% gain in motor vehicles and parts. Overall, total industrial production in November was 5.3% above its year-earlier level and the highest since September 2019. Capacity utilization for the industrial sector improved 0.3 percentage point to 76.8%, but was still 2.8 percentage points below its long-run (1972-2020) average.
- For the week ended December 11, there were 206,000 new claims for unemployment insurance, a decrease of 18,000 from the previous week’s level, which was revised up by 4,000. The four-week moving average was 203,750, the lowest level for this average since November 15, 1969. According to the Department of Labor, the advance rate for insured unemployment claims for the week ended December 4 was 1.4%, a decrease of 0.1 percentage point from the previous week’s rate. The advance number of those receiving unemployment insurance benefits during the week ended December 4 was 1,845,000, a decrease of 154,000 from the prior week’s level, which was revised up by 7,000. For comparison, last year at this time there were 929,000 initial claims for unemployment insurance, and the rate for unemployment claims was 3.7%. During the last week of February 2020 (pre-pandemic), there were 219,000 initial claims for unemployment insurance, and the number of those receiving unemployment insurance benefits was 1,724,000. States and territories with the highest insured unemployment rates for the week ended November 27 were Alaska (3.2%), California (2.9%), the Virgin Islands (2.7%), the District of Columbia (2.6%), Puerto Rico (2.6%), New Jersey (2.5%), Hawaii (2.3%), Illinois (2.2%), Minnesota (2.2%), and Georgia (2.1%). The largest increases in initial claims for the week ended December 4 were in Texas (+8,639), New York (+8,523), California (+8,487), Michigan (+4,182), and Illinois (+3,390), while the largest decreases were in Virginia (-3,096) and North Carolina (-1,718).
Eye on the Week Ahead
In consideration of the Christmas-New Year holidays next week, several important economic reports are available this week. The final report on third-quarter gross domestic product is available this week. The economy advanced at an annualized rate of 2.1%, according to the second estimate. November data on sales of new and existing homes is also out this week. October proved to be a good month for the housing sector, although residential sales may curtail a bit in November. The personal income and outlays report is also out, albeit a week earlier than normal. According to the previous report, prices at the consumer level have risen 5.0% for the 12 months ended in October.
The Week Ahead

The information provided is obtained from sources believed to be reliable. Forecasts cannot be guaranteed. Past performance is not a guarantee of future results.
© 2021 Broadridge Financial Solutions, Inc. All Rights Reserved.