The markets seemed to react with fear last week. The major indexes fell, with about 90% of S&P 500 stocks losing ground and every major market sector closing in the red. Investors turned to bonds, sending the price of 10-year Treasury notes up and the yield down. Wall Street is also preparing for what is expected to be the first 50-basis point increase in the federal funds rate since 2000, following the meeting of the Federal Open Market Committee this Tuesday and Wednesday. The Nasdaq (-3.9%) and the Russell 2000 (-4.1%) led the drop in the indexes, followed by the S&P 500 (-3.3%), the Global Dow (-3.0%), and the Dow (-2.5%). Crude oil prices added more than $3.00 to climb past $104.00 per barrel. The dollar advanced, while gold prices slid.
Last Monday, tech stocks posted solid gains, helping to drive the major benchmark indexes higher. Conversely, stocks that move with the economy slid lower as a rise in COVID-19 cases in China raised concerns about a global economic slowdown. Energy, materials, real estate, and utilities were sectors that performed poorly, while communication services, consumer discretionary, and information technology moved higher. Among the market indexes, the Nasdaq (1.3%) led the advance, followed by the Dow (0.7%), the Russell 2000 (0.7%), and the S&P 500 (0.6%). The Global Dow fell 1.3%. Ten-year Treasury yields dipped 8 basis points to close at 2.82%. The dollar continued to rise, increasing $0.52 to $101.74. Crude oil prices dropped $3.34 to $98.73 per barrel.
Stocks fell last Tuesday, unable to maintain the previous day’s momentum. Disappointing first-quarter earnings data from some major companies, coupled with more shutdowns in China in response to the increasing spread of the coronavirus, helped drive stocks to a six-week low. The Nasdaq (-4.0%) and the Russell 2000 (-3.3%) dropped the furthest, followed by the S&P 500 (-2.8%), the Dow (-2.4%), and the Global Dow (-1.6%). Bond prices continued to climb, pulling yields lower, with 10-year Treasury yields slipping 5.4 basis points to 2.77%. The dollar, crude oil, and gold prices advanced.
Equities closed last Wednesday with mixed results following a choppy day of trading. The Dow and the S&P 500 edged up 0.2%, while the Russell 2000 and the Global Dow fell 0.3%. The Nasdaq ended the day flat. Ten-year Treasury yields ended a streak of declines after rising 4.6 basis points to close at 2.81%. Crude oil prices climbed to $102.24 per barrel as the European Union’s ban on Russian crude gained support from Germany. The dollar rose higher for the sixth straight session.
Wall Street continued to be marked by volatility as stocks shot higher last Thursday. Favorable first-quarter earnings reports from several large companies provided the impetus behind the market’s best rally in seven weeks. The Nasdaq jumped 3.1% and the S&P 500 added 2.5% to lead the benchmark indexes listed here. The Dow (1.9%), the Russell 2000 (1.8%), and the Global Dow (1.3%) also edged higher. Bond prices slid, pushing yields higher, with 10-year Treasuries gaining 4.5 basis points to 2.86%. Crude oil prices also advanced, gaining $3.31 to reach $105.33 per barrel. The dollar rose again, as did gold prices.
Stocks closed last Friday in the red, with each of the benchmark indexes listed here losing value. Disappointing first-quarter earnings reports from some major tech companies drove tech shares lower, causing the S&P 500 (-3.6%) and the Nasdaq (-4.2%) to tumble. The Dow lost nearly 900 points, ultimately giving back 2.8% by the close of trading last Friday. The Russell 2000 fell about 3.0% and the Global Dow slipped 1.0%. Ten-year Treasury yields rose 2.4 basis points to 2.88%. Crude oil prices declined $1.30 to $104.07 per barrel. The dollar dipped for the first time in several sessions.
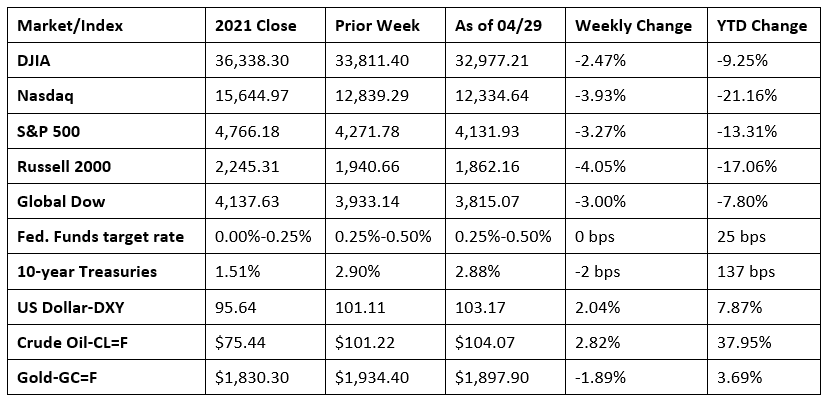
Chart reflects price changes, not total return. Because it does not include dividends or splits, it should not be used to benchmark performance of specific investments.
Last Week’s Economic News
- Not unexpectedly, the initial, or advance, estimate of the first quarter gross domestic product for 2022 slid 1.4% after increasing 6.9% in the fourth quarter of 2021. While this data is somewhat incomplete and based on assumptions, as these numbers will probably change when more complete data becomes available over the next two months. Also, much of the decline in GDP is likely due more to geopolitical events (e.g., the Ukraine war, China COVID lockdown) and not necessarily attributable to significant weakness in the U.S. economy. A primary cause in the decrease in GDP can be traced to an expansion of net exports. Goods exports fell 9.6%, while exports of services rose 3.8%. On the other hand, imports of goods rose 20.5%, and services advanced 4.1%. There were also negative contributions from private inventories and government expenditures. However, an important economic indicator, personal consumption expenditures, increased 2.7% (2.5% in the fourth quarter). Also of note, the personal consumption expenditures price index, a measure of inflation, increased 7.0% compared with an increase of 6.4% in the previous quarter.
- Overall, income and prices climbed higher in March, further evidence of rising inflationary pressures. According to the latest data from the Bureau of Economic Analysis, both personal income and disposable personal income increased 0.5% in March. The personal consumption price index, a measure of inflation valued by the Federal Reserve, increased 0.9% in March and 6.6% from one year ago. Energy prices climbed 33.9%, while food prices advanced 9.2%. Excluding food and energy, prices have increased 5.2% since March 2021. Consumer spending climbed 1.1% in March. Wages and salaries advanced 0.6% in March, while payouts for unemployment insurance benefits fell 7.2% as the job market recovers from pandemic-related layoffs. Consumers spent more on nondurable goods such as food and energy and services. Expenditures on durable goods fell 1.0%.
- New orders for durable goods rose 0.8% in March, rebounding from a 1.7% decrease in February. Excluding transportation, new orders increased 1.1%. Excluding defense, new orders increased 1.2%. Computers and electronic products, up for two of the last three months, led the increase, climbing 2.6%. New orders for nondefense capital goods decreased 0.5% in March, and new orders for defense capital goods fell 5.6%. Over the 12 months ended in March, new orders for durable goods have advanced 12.6%.
- Sales of new single-family homes fell 8.6% in March and are 12.6% below the March 2021 estimate. The median sales price of new houses sold in March 2022 was $436,700. The average sales price was $523,900. In March, inventory of new single-family homes for sale represented a supply of 6.4 months at the current sales rate.
- The advance report on the international trade in goods deficit, released April 27, shows that the trade deficit for March rose $19.0 billion, or 17.8%, to $125.3 billion. Exports increased $11.4 billion, or 7.2%, in March. Imports rose $30.3 billion, or 11.5%, in March. Since March 2021, the trade in goods balance has increased 37.3%.
- The national average retail price for regular gasoline was $4.107 per gallon on April 25, $0.041 per gallon above the prior week’s price and $1.235 higher than a year ago. Also as of April 25, the East Coast price increased $0.06 to $3.98 per gallon; the Gulf Coast price rose $0.06 to $3.79 per gallon; the Midwest price climbed $0.04 to $3.92 per gallon; the West Coast price decreased $0.01 to $5.08 per gallon; and the Rocky Mountain price edged up $0.04 to $4.19 per gallon. Residential heating oil prices averaged $3.94 per gallon on April 22, about $0.08 per gallon more than the prior week’s price. U.S. crude oil refinery inputs averaged 15.7 million barrels per day during the week ended April 22, which was 33,000 barrels per day less than the previous week’s average. During the week ended April 22, refineries operated at 90.3% of their operable capacity, and gasoline production decreased, averaging 9.5 million barrels per day.
- For the week ended April 23, there were 180,000 new claims for unemployment insurance, a decrease of 5,000 from the previous week’s level, which was revised up by 1,000. According to the Department of Labor, the advance rate for insured unemployment claims for the week ended April 16 was 1.0%, unchanged from the previous week’s rate. The advance number of those receiving unemployment insurance benefits during the week ended April 16 was 1,408,000, a decrease of 1,000 from the previous week’s level. This is the lowest level for insured unemployment since February 7, 1970, when it was 1,397,000. States and territories with the highest insured unemployment rates for the week ended April 9 were California (2.2%), New Jersey (2.2%), Alaska (1.9%), Minnesota (1.8%), New York (1.6%), Rhode Island (1.6%), Illinois (1.5%), Massachusetts (1.5%), Pennsylvania (1.3%), and Puerto Rico (1.3%). The largest increases in initial claims for the week ended April 16 were in Connecticut (+1,391), New Jersey (+1,116), Rhode Island (+368), Montana (+340), and Maryland (+147), while the largest decreases were in Missouri (-7,498), Michigan (-3,509), New York (-2,956), Ohio (-2,902), and Texas (-2,330).
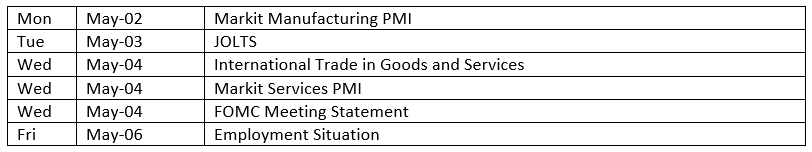
Eye on the Week Ahead
The Federal Open Market Committee meets this week, the results of which are almost certainly to include at least a 50-basis point interest-rate hike. The April employment figures are also available this week. There were 431,000 new jobs added in March. Average hourly earnings have risen 5.6% since March 2021.
The Week Ahead
The information provided is obtained from sources believed to be reliable. Forecasts cannot be guaranteed. Past performance is not a guarantee of future results.
© 2021 Broadridge Financial Solutions, Inc. All Rights Reserved.