Despite an end-of-week surge, stocks closed last week lower. Recession fears resulted in traders moving to bonds, driving prices higher and yields lower. As another round of corporate earnings reports nears, investors are bracing for weaker results, which could dampen trader sentiment and send stocks tumbling lower. With last Friday marking the start of the second half of the year, stocks are likely to continue to ride the volatility train. By the end of last week, each of the indexes listed here slid lower, led by the tech-heavy Nasdaq. Ten-year Treasury yields fell 25 basis points. The dollar rose marginally. Gold prices dipped lower. Crude oil prices climbed higher.
Stocks kicked off last week on a down note as Wall Street was unable to maintain the prior week’s rally. The Nasdaq (-0.7%), the S&P 500 (-0.3%), and the Dow (-0.2%) underperformed, while the Russell 2000 (0.3%) and the Global Dow (0.5%) edged higher. Among the market sectors of the S&P 500, only energy, utilities, and health care advanced. Ten-year Treasury yields advanced nearly 7 basis points to close at 3.19%. Crude oil prices rose by more than $2.00 to reach $109.82 per barrel. The dollar and gold prices fell.
Equities continued to tumble last Tuesday, with each of the benchmark indexes listed here closing the day in the red. Megacaps and growth stocks lagged, giving back gains from the previous week. The Nasdaq fell 3.0%, followed by the S&P 500 (-2.0%), the Russell 2000 (-1.8%), the Dow (-1.6%), and the Global Dow (-0.5%). Traders may have reacted to the latest report on waning consumer confidence, with economic expectations hitting a nearly 10-year low. Crude oil prices advanced for the third day as prices jumped another $2.00 to reach $111.68 per barrel. Ten-year Treasury yields climbed marginally higher, while the dollar rose against a bucket of currencies.
Only the Dow was able to eke out a gain last Wednesday after another choppy day of trading. The Russell 2000 fell the furthest, dropping 1.1%, followed by the Global Dow, which lost 1.0%. The S&P 500 and the Nasdaq slid less than 0.1%. Bond prices jumped higher, sending yields lower. Ten-year Treasury yields declined 11.3 basis points to close at 3.09%. Crude oil prices fell for the first time in four days, dropping $2.44 to $109.32 per barrel. The dollar advanced for a second consecutive day. Although Federal Reserve Chair Jerome Powell said the U.S. is in “strong shape” and “well positioned to withstand tighter monetary policy,” first-quarter consumer spending expanded at its softest pace since the beginning of the pandemic, possibly indicating the economy isn’t on such strong footing.
June ended last Thursday with equities continuing to tumble lower. Fears of a recession on the heels of rising inflation swayed investors from risk. Megacaps, banks, retailers, metals and mining, and airlines lagged on the day. Once again, the Nasdaq led the losing benchmark indexes, dropping 1.3%, followed by the Global Dow (-1.2%), the S&P 500 (-0.9%), the Dow (-0.8%), and the Russell 2000 (-0.7%). Treasury yields shed 12 basis points, finishing the day at 2.97%. Crude oil prices inched higher, along with the dollar. Gold prices lagged marginally.
July started last Friday with Treasury prices surging driving yields lower. The yield on 10-year Treasuries lost 8.3 basis points to end the day at 2.88%. Each of the benchmark indexes listed here added value, led by the Russell 2000 (1.2%), followed by the S&P 500 and the Dow, which each gained 1.1%. The Nasdaq rose 0.9%, while the Global Dow advanced 0.3%. Crude oil prices jumped $2.63 to close at $108.39 per barrel amid supply outages in Libya and expected shutdowns in Norway. The dollar and gold prices also advanced on the day.
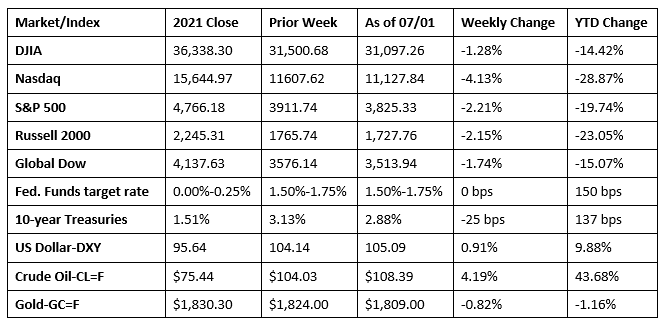
Chart reflects price changes, not total return. Because it does not include dividends or splits, it should not be used to benchmark performance of specific investments.
Last Week’s Economic News
- First-quarter gross domestic product decelerated at an annual rate of 1.6%, according to the final estimate from the Bureau of Economic Analysis. In the fourth quarter of 2021, GDP increased 6.9%. The decrease in GDP reflected declines in exports, federal, state, and local government spending, and private inventory investment, while imports, which are a subtraction in the calculation of GDP, increased. Nonresidential fixed investment, personal consumption expenditures, and residential fixed investment increased. The increase in personal consumption expenditures, a main driver of overall GDP, increased 1.8% following a 2.5% increase in the previous quarter. Driving PCE higher was an increase in spending on services (led by housing and utilities) that was partly offset by a decrease in spending on goods. Within goods, widespread decreases in nondurable goods (led by groceries as well as gasoline and other energy goods) were largely offset by an increase in durable goods (led by motor vehicles and parts). The personal consumption expenditures price index, a measure of inflation, increased 7.1%. Excluding food and energy, consumer prices increased 5.2%.
- Consumer prices rose 0.6% in May and are up 6.3% over the past 12 months, according to the latest report from the Bureau of Economic Analysis. Personal income and disposable (after-tax) personal income increased 0.5% in May. Personal consumption expenditures rose 0.2% in May, a much smaller increase than in April (0.6%) and March (1.2%), likely indicative of a shift in household spending away from discretionary items as prices for necessities, such as food and energy, increased.
- New orders for long-lasting durable goods increased 0.7% in May, the seventh monthly increase out of the last eight months. The May increase was widespread. Materials that notably increased include primary metals (3.1%), machinery (1.1%), communications equipment (2.0%), defense aircraft and parts (8.1%), and transportation equipment (0.8%). New orders for nondefense capital goods in May increased 0.5%, while new orders for defense capital goods jumped 2.6%.
- According to the S&P Global US Manufacturing PMI™ report, the purchasing managers’ index dropped to its lowest level since July 2020 amid a near-stagnation of factory output and a fall in new orders. The PMI posted 52.7 in June, down from 57.0 in May. The June reading was the lowest in nearly two years. The decrease in sales was the first since May 2020, with domestic and foreign client demand falling. A reduction in new orders, combined with a sustained rise in employment, led to greater success clearing backlogs of work. While inflationary pressures remained historically elevated, increases in input costs and output charges eased to three-month lows.
- The international trade in goods deficit for May was $104.3 billion, down $2.4 billion, or 2.2%, from the April deficit. Exports of goods for May were $2.0 billion, or 1.2%, more than April exports. However, imports of goods for May were $0.4 billion, or -0.1%, less than April imports. Since May 2021, exports are up 22.0% and imports have risen 21.3%.
- The national average retail price for regular gasoline was $4.87 per gallon on June 27, $0.090 per gallon below the prior week’s price but $1.781 higher than a year ago. Also as of June 27, the East Coast price decreased $0.10 to $4.69 per gallon; the Gulf Coast price fell $0.11 to $4.50 per gallon; the Midwest price dropped $0.09 to $4.82 per gallon; the West Coast price slid $0.07 to $5.79 per gallon; and the Rocky Mountain price dipped $0.01 to $4.98 per gallon. Residential heating oil prices averaged $4.36 per gallon on June 24, about $0.02 per gallon more than the prior week’s price. According to the U.S. Energy Information Administration, gas demand currently sits at 8.93 million barrels per day, which is lower than last year’s rate of 9.11 million barrels per day at the end of June. On the other hand, total domestic gasoline stocks increased by 2.6 million barrels. These supply/demand dynamics and decreasing oil prices have pushed pump prices lower.
- For the week ended June 25, there were 231,000 new claims for unemployment insurance, a decrease of 2,000 from the previous week’s level, which was revised up by 4,000. According to the Department of Labor, the advance rate for insured unemployment claims for the week ended June 18 was 0.9%, a decrease of 0.1 percentage point from the previous week’s rate, which was revised up by 0.1 percentage point to 1.0%. The advance number of those receiving unemployment insurance benefits during the week ended June 18 was 1,328,000, a decrease of 3,000 from the previous week’s level, which was revised up by 16,000. States and territories with the highest insured unemployment rates for the week ended June 11 were California (1.8%), New Jersey (1.8%), Puerto Rico (1.6%), Alaska (1.4%), New York (1.4%), Pennsylvania (1.4%), Rhode Island (1.3%), Hawaii (1.2%), Illinois (1.2%), and Massachusetts (1.2%). The largest increases in initial claims for the week ended June 18 were in Michigan (+1,849), Texas (+1,350), New Jersey (+897), Connecticut (+863), and Puerto Rico (+860), while the largest decreases were in Illinois (-2,595), California (-1,189), South Carolina (-731), Georgia (-621), and Florida (-535).
Eye on the Week Ahead
The employment data for June is available this week. May saw 390,000 new jobs added, and hourly wages increased by 0.3%. For the 12 months ended in May, wages have risen 5.2%, driven higher by greater employer demand for workers.
The Week Ahead

The information provided is obtained from sources believed to be reliable. Forecasts cannot be guaranteed. Past performance is not a guarantee of future results.
© 2021 Broadridge Financial Solutions, Inc. All Rights Reserved.