Inflation is still rising, albeit at a slower pace, according to the latest data out last week. This will likely support further interest-rate increases from the Federal Reserve and worries of a resulting economic recession. Stocks retreated, culminating in the worst week since June. The Nasdaq suffered through its worst week since January after falling nearly 5.5%. The S&P 500, the Russell 2000, and the Dow lost at least 4.0%. The Global Dow also ended last week well in the red. Crude oil prices declined for a third consecutive week, while gold prices continued to slide, despite a bump higher at the end of the week. The dollar inched higher. Year to date, while all of the benchmark indexes listed here are well below their 2021 closing values, the Nasdaq has fallen nearly 27.0%.
Wall Street rallied last Monday ahead of the latest Consumer Price Index report that investors hope would show that inflation is peaking. The S&P 500 rose for the fourth consecutive session after gaining 1.1%, marking its longest winning streak in two months. The Nasdaq climbed 1.3%, the Russell 2000 added 1.2%, the Dow advanced 0.7%, and the Global Dow jumped 1.4%. The dollar slid lower, while 10-year Treasury yields increased 4.1 basis points to close the day at 3.61%. Crude oil prices rose $1.12 to reach $87.91 per barrel.
Stocks reacted negatively after last Tuesday’s hotter-than-expected CPI report showed that inflation probably hasn’t peaked quite yet. Each of the benchmark indexes listed here ended the trading session in the red, wiping out practically all of the gains attained over the prior four sessions. The Nasdaq dropped 5.2%, followed by the S&P 500 (-4.3%), the Dow and the Russell 2000 (-3.9%), and the Global Dow (-2.9%). Ten-year Treasury yields climbed to 3.42%. The dollar jumped 1.4%, while gold prices slid 1.6%. Crude oil prices dipped to $87.50 per barrel.
Dip buyers seized the opportunity to snatch some undervalued stocks last Wednesday, nudging Wall Street slightly higher following the biggest single-day rout in two years. The Nasdaq gained 0.7%, the Russell 2000 added 0.4%, the S&P 500 rose 0.3%, and the Dow inched up 0.1%. The Global Dow fell 0.2%. Ten-year Treasury yields slipped to 3.41%. The dollar and gold prices fell. Crude oil prices edged up by nearly $1.50, closing at roughly $88.80 per barrel.
Stocks closed lower last Thursday, with each of the benchmark indexes listed here losing value. While stock values declined, bond yields rose. The yield on 10-year Treasuries closed at 3.45%, while the two-year Treasury yield hit 3.87%, the highest rate since October 2007. The Nasdaq dropped 1.4%, the S&P 500 slid 1.1%, the Global Dow fell 0.8%, the Russell 2000 dipped 0.7%, and the Dow lost 0.6%. Crude oil prices fell nearly 3.7%, dropping to $85.18 per barrel. The dollar inched higher, while gold prices declined to $1,673.40 per ounce, the lowest price in over a year.
Equities fell last Friday after a major delivery service company announced weak quarterly results. The Russell 2000 (-1.5%) and the Global Dow (-1.1%) dipped the furthest, followed by the Nasdaq (-0.9%), the S&P 500 (-0.7%), and the Dow (-0.5%). The yield on 10-year Treasuries slipped 1.0 basis point to 3.44%. Crude oil prices rose by $0.15 to $85.25, the dollar was flat, while gold prices jumped $6.40 to $1,683.70 per ounce.
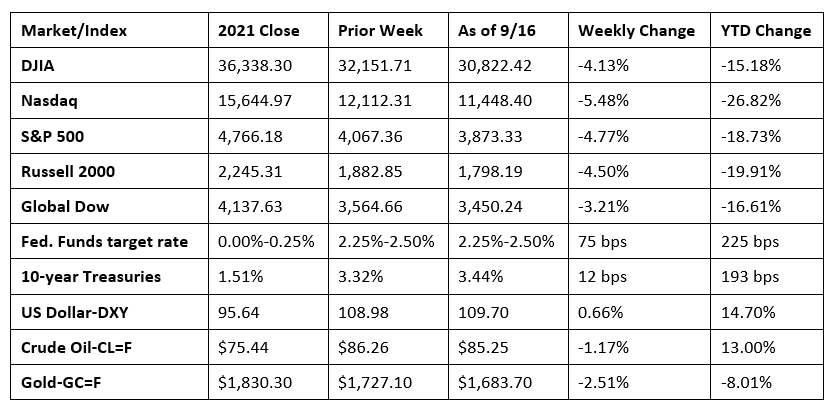
Chart reflects price changes, not total return. Because it does not include dividends or splits, it should not be used to benchmark performance of specific investments.
Last Week’s Economic News
- The latest data does not support the Federal Reserve scaling back its aggressive policies aimed at curbing inflation. The Consumer Price Index advanced 0.1% in August after being unchanged in July. Price increases were broad-based in August, with shelter, food, and medical care among the largest contributors. Those increases were mostly offset by a 10.6% decrease in gasoline prices. Other areas that declined last month included airline fares, communication, and used cars and trucks. Core prices, excluding volatile food and energy, rose 0.6% last month, higher than the 0.3% increase in July. For the 12 months ended in August, the CPI advanced 8.3%, down marginally from the 8.5% increase for the year ended in July. Core prices rose 6.1% for the 12 months ended in August, up from the 5.9% increase for the 12 months ended in July.
- Prices at the producer level fell in August for the second consecutive month. The Producer Price Index (a gauge of prices at the wholesale level) declined 0.1% last month after decreasing 0.4% in July. For the 12 months ended in August, producer prices have risen 8.7%, the lowest annual increase since August 2021. Prices for goods fell 1.2% in August, while prices for services rose 0.4%. Producer prices less food, energy, and trade services moved up 0.2% in August, and have increased 5.6% over the past 12 months. Pulling goods prices lower was a 6.0% drop in energy prices, led by a 12.7% decline in gasoline prices. Goods prices less foods and energy actually rose 0.2% last month.
- Both import and export prices declined in August. Import prices fell 1.0% last month after retreating 1.5% in July. Import prices advanced 7.8% for the year ended in August, the smallest 12-month increase since the 12-months ended in March 2021. Import fuel prices decreased 6.8% in August for the second consecutive month. Despite the recent declines, import fuel prices rose 48.5% from August 2021 to August 2022. Prices for nonfuel imports declined 0.2 percent in August following a 0.5- percent decrease in July. Lower agricultural and nonagricultural prices each contributed to the August decline in export prices. Nevertheless, export prices advanced 10.8% over the past 12 months.
- Retail food and services sales for August rose 0.3% from the previous month and 9.1% above August 2021. Retail trade sales were up 0.2% in August and 8.9% over the past 12 months. Businesses that saw an increase in sales last month included motor vehicle and parts dealers; building material and garden equipment and supplies dealers; food and beverage stores; clothing and clothing accessories stores; sporting goods, hobby, musical instrument, and book stores; general merchandise stores; and food services and drinking places. Nonstore (online) retailers saw sales drop in August, as did gasoline stations, health and personal care stores, and furniture and home furnishing stores.
- Industrial production decreased 0.2% in August. Manufacturing output edged up 0.1% after increasing 0.6% in July. The index for mining was unchanged, while the index for utilities decreased 2.3%. Total industrial production in August was 3.7% above its year-earlier level.
- The federal government deficit for August was $219.6 billion, $8.5 billion greater than the July deficit. Through 10 months of the fiscal year, the deficits sits at $945.7 billion, 187% under the deficit over the same period in the previous fiscal year. Total government receipts for this fiscal year are $4,408.4 billion compared to $3,586.5 billion over the same period in the last fiscal year. Conversely, total government outlays through the first 10 months of this fiscal year are $942.9 billion less than the government expenditures over the same period in the previous fiscal year.
- The national average retail price for regular gasoline was $3.690 per gallon on September 12, $0.056 per gallon below the prior week’s price but $0.525 higher than a year ago. Also as of September 12, the East Coast price decreased $0.086 to $3.527 per gallon; the Gulf Coast price fell $0.103 to $3.126 per gallon; the Midwest price dropped $0.067 to $3.571 per gallon; the West Coast price slid $0.084 to $4.825 per gallon; and the Rocky Mountain price fell $0.051 to $3.889 per gallon. Residential heating oil prices averaged $3.579 per gallon on September 9, about $0.001 per gallon more than the prior week’s price. In the first half of 2022, U.S. exports of petroleum products averaged nearly 6.0 million barrels per day, or 11.0%, over the same period last year. According to the latest data from the U.S. Energy Information Administration, the increase in exports of petroleum products is the highest first half of the year exports since 1981.
- For the week ended September 10, there were 213,000 new claims for unemployment insurance, a decrease of 5,000 from the previous week’s level, which was revised down by 4,000. According to the Department of Labor, the advance rate for insured unemployment claims for the week ended September 3 was 1.0%, unchanged from the previous week’s rate. The advance number of those receiving unemployment insurance benefits during the week ended September 3 was 1,403,000, an increase of 2,000 from the previous week’s level, which was revised down by 72,000. States and territories with the highest insured unemployment rates for the week ended August 27 were New Jersey (2.2%), California (1.8%), Rhode Island (1.8%), New York (1.7%), Puerto Rico (1.7%), Connecticut (1.6%), Massachusetts (1.5%), Pennsylvania (1.3%), Nevada (1.2%), Illinois (1.1%), and Oregon (1.1%).The largest increases in initial claims for the week ended September 3 were in Oklahoma (+1,935), Pennsylvania (+1,069), Kentucky (+824), Ohio (+659), and Indiana (+610), while the largest decreases were in New York (-3,662), Michigan (-2,132), Connecticut (-1,285), Alabama (-314), and Virginia (-310).
Eye on the Week Ahead
The August data for housing starts and existing home sales is available this week. The residential sector has slowed considerably from its torrid pace in 2021. Also this week, attention is focused on the latest meeting of the Federal Open Market Committee. It is expected that the Committee will hike interest rates by 75 basis points as it attempts to temper rising inflation.
The Week Ahead

The information provided is obtained from sources believed to be reliable. Forecasts cannot be guaranteed. Past performance is not a guarantee of future results.
© 2021 Broadridge Financial Solutions, Inc. All Rights Reserved.