Investors endured their second harrowing week in a row as the Federal Reserve continued to raise interest rates aggressively to combat inflation. New signs of slowing global growth and Russia’s threats to escalate the war in Ukraine provided more reasons for selloffs in the stock and bond markets by nervous investors. The Nasdaq, the Russell 2000, and the S&P 500 all sunk deeper into bear territory, and the Dow dropped to its lowest level of 2022. In a cruel twist of fate, bonds are not behaving like the port in the storm that investors tend to expect. Treasury prices have fallen and yields have risen to heights not seen in more than a decade. The dollar is exhibiting unusual strength against many foreign currencies, including the pound, the euro and the yen. Oil prices fell to their lowest levels since January.
Stocks pushed higher to end last Monday, rallying from what had been the worst week of performance since June. Each of the benchmark indexes listed here posted moderate to solid gains, led by the Russell 2000 and the Nasdaq, which gained 0.8%. A spike in megacaps helped drive the rebound. The S&P 500 rose 0.7% and the Dow climbed 0.6%. The Global Dow inched 0.3% higher. Traders tried to gauge the impact of what is expected to be another 75-basis point rate hike from the Federal Reserve. Ten-year Treasury yields rose to 3.49%, while two-year Treasury yields, which are more sensitive to near-term interest-rate movements, hit their highest rate since 2007 after climbing to 3.94%. Crude oil prices moved marginally higher, closing at $85.53 per barrel. The dollar edged lower, while gold prices advanced.
Wall Street saw stocks tumble lower last Tuesday, while Treasury yields jumped higher as investors braced for the Federal Reserve’s expected interest-rate boost. The Russell 2000 (-1.4%) fell the furthest among the benchmark indexes listed here, followed by the S&P 500 (-1.1%), the Dow and the Global Dow (-1.0%), and the Nasdaq (-0.9%). Ten-year Treasury yields climbed 8.1 basis points to 3.57%, while the yield on the two-year Note rose to 3.96%. Crude oil prices fell 1.8%, sliding to $84.19 per barrel. The dollar advanced, while gold prices dipped lower.
Last Wednesday, investors reacted to the 75-basis point interest-rate hike by moving away from stocks. Each of the benchmark indexes listed here closed the session in the red, with only the Russell 2000 and the Global Dow falling less than 1.7% (-1.4% and -1.5%, respectively). The Nasdaq dropped 1.8%, while the S&P 500 and the Dow fell 1.7%. Bond prices climbed higher, pulling yields lower. Ten-year Treasury yields decreased 6.1 basis points to end the day at 3.51%. Crude oil prices declined for the second consecutive day, falling to $83.09 per barrel. The dollar rose for the second day in a row, while gold prices advanced, reversing the previous day’s fall.
Wall Street tumbled lower for the third consecutive session last Thursday. Each of the benchmark indexes listed here lost value, with the Russell 2000 falling 2.3% and the Nasdaq dropping 1.4%. The S&P 500 and the Global Dow slid 0.8%, and the Dow slipped 0.4%. Traders continued to react to the Federal Reserve’s aggressive measures to rein in inflation by selling stocks, particularly growth shares, including technology stocks. Ten-year Treasury yields added nearly 20 basis points, reaching 3.70%. Crude oil prices and the dollar inched higher. Gold prices rose $4.00, hitting $1,679.70 per ounce.
On Friday, stock market investors continued their tantrum for a fourth straight day after a report showed that economic activity in Europe declined sharply in September. The Global Dow took the biggest hit, skidding 2.6%, followed closely by the Russell 2000 (-2.5%). The Nasdaq dropped 1.8% and S&P 500 fell 1.7%. The Dow was down 1.6%, ending the day at its lowest level of 2022. Energy stocks took a particularly hard beating, as crude oil plunged 5% to land below $80 per barrel. Gold prices fell and the dollar strengthened. Ten-yield Treasury yields were little changed.
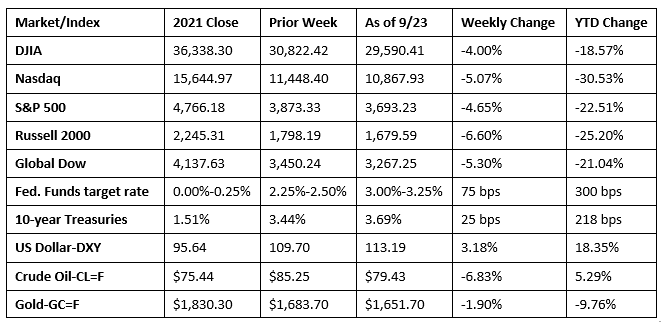
Chart reflects price changes, not total return. Because it does not include dividends or splits, it should not be used to benchmark performance of specific investments.
Last Week’s Economic News
- As expected, the Federal Open Market Committee raised the target range for the federal funds rate 75 basis points to 3.00%-3.25%, and anticipates that ongoing increases will be appropriate. This is the highest level for the federal funds rate since 2008. According to Fed Chair Jerome Powell, the Committee is committed to bringing inflation back down to their 2.0% goal. In continuing to push interest rates higher, the FOMC suggested that the economy is resilient, highlighting modest growth in spending and production, although August data showed that inflation continued to rise, albeit at a slower pace. According to Federal Reserve projections, officials see inflation rising to 5.4% this year. The federal funds rate is projected to increase to 4.4% by the end of this year and 4.6% by the close of 2023, which the Fed expects will bring inflation down to 2.8% by the end of next year.
- The number of housing starts increased by 12.2% in August over July’s total. However, building permits and housing completions slid lower, 10.0% and 5.4%, respectively. Building permits for single-family homes dipped 3.5% last month, while housing completions (0.4%) and housing starts (3.4%) increased.
- Sales of existing homes slid lower for the seventh consecutive month in August after declining 0.4%. Existing home sales are down 19.9% since August 2021. While mortgage rates have risen, existing home prices have not decreased at the same pace and remain somewhat elevated. Total housing inventory sat at a 3.2-month supply in August, unchanged from July. The median existing-home price for all housing types was $389,500 in August, higher than the August 2021 price of $361,500 but lower than the July price of $399,200. Sales of existing single-family homes also declined in August, down 0.9% from July and 19.2% below the August 2021 pace. The median existing single-family home price in August was $396,300, down from the July price of $405,800. The August decline was the second consecutive monthly decrease in the median sales price for existing single-family homes.
- The national average retail price for regular gasoline was $3.654 per gallon on September 19, $0.036 per gallon below the prior week’s price but $0.470 higher than a year ago. Also as of September 19, the East Coast price decreased $0.070 to $3.457 per gallon; the Gulf Coast price rose $0.031 to $3.157 per gallon; the Midwest price dropped $0.053 to $3.518 per gallon; the West Coast price increased $0.020 to $4.845 per gallon; and the Rocky Mountain price fell $0.012 to $3.877 per gallon. Residential heating oil prices averaged $3.173 per gallon on September 16, about $0.406 per gallon less than the prior week’s price.
- For the week ended September 17, there were 213,000 new claims for unemployment insurance, an increase of 5,000 from the previous week’s level, which was revised down by 5,000. According to the Department of Labor, the advance rate for insured unemployment claims for the week ended September 10 was 1.0%, unchanged from the previous week’s rate. The advance number of those receiving unemployment insurance benefits during the week ended September 10 was 1,379,000, a decrease of 22,000 from the previous week’s level, which was revised down by 2,000. States and territories with the highest insured unemployment rates for the week ended September 3 were New Jersey (2.0%), California (1.7%), New York (1.6%), Puerto Rico (1.6%), Rhode Island (1.4%), Massachusetts (1.3%), Connecticut (1.2%), Nevada (1.2%), Pennsylvania (1.1%), Alaska (1.1%), and Oregon (1.1%). The largest increases in initial claims for the week ended September 10 were in Indiana (+738), Arkansas (+217), Iowa (+149), North Dakota (+28), and Maine (+15), and while the largest decreases were in California (-3,064), New York (-2,905), Texas (-2,493), Oklahoma (-1,729), and Pennsylvania (-1,355).
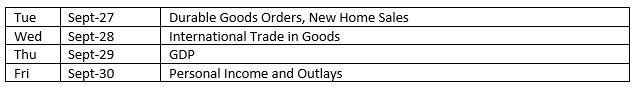
Eye on the Week Ahead
There are plenty of important economic reports out during the last week of September. The final estimate of gross domestic product is out this week. It is not expected to change much from the prior estimate, which showed the economy retracted by 0.6% in the second quarter. The report on personal income and outlays for August is also available this week. The personal consumption expenditures price index, a key inflation indicator favored by the Federal Reserve, is included in this report.
The Week Ahead
The information provided is obtained from sources believed to be reliable. Forecasts cannot be guaranteed. Past performance is not a guarantee of future results.
© 2021 Broadridge Financial Solutions, Inc. All Rights Reserved.