Stocks fell last week following warnings from several Federal Reserve officials that more policy tightening was to come. Each of the benchmark indexes listed here closed the week lower after enjoying solid gains the previous week. The Russell 2000 and the Nasdaq fell the furthest, followed by the S&P 500, the Global Dow, and the Dow. Yields on 10-year Treasuries ended last week right where they began. Gold prices couldn’t maintain an early-week surge, ultimately closing lower by the close of trading last Friday. The dollar gained about 0.05%. An abundant supply and waning demand sent crude oil prices lower for the second week in a row.
Stocks closed lower last Monday, unable to maintain their rally from the previous week. Among the benchmark indexes listed here, the Nasdaq and the Russell 2000 (-1.1%) slid the furthest, followed by the S&P 500 (-0.9%), the Dow (-0.6%), and the Global Dow (-0.4%). Crude oil prices lost $3.70, falling to $85.27 per barrel, the lowest price in roughly three weeks as short-term demand appeared to be waning. The yield on 10-year Treasuries added 5.2 basis points to reach 3.86%. The dollar and gold prices advanced.
Equities rose higher last Tuesday on soft inflation data. Investors hoped that inflation may have peaked following the release of a lower-than-expected producer price index report for October. The Russell 2000 and the Nasdaq led the benchmark indexes listed here, both advancing 1.5%. The Global Dow climbed 1.0%, followed by the S&P 500 (0.9%) and the Dow (0.2%). Ten-year Treasury yields fell 6.6 basis points to close the session at 3.79%. The dollar slipped lower, while gold prices advanced 0.3%. Crude oil prices added nearly $1.00 to reach $86.86 per barrel.
Stocks slid lower last Wednesday as a strong retail sales report indicated the economy may be able to withstand additional interest-rate hikes. The Nasdaq, which is typically more sensitive to interest rates, fell 1.5%, while the Russell 2000 lost 1.9%. Roughly 68% of the S&P 500 companies lost value, dragging that index down 0.8%. The Global Dow declined 0.8% and the Dow slipped 0.1%. Bond prices advanced, pulling yields lower. Ten-year Treasury yields fell 10.7 basis points to end the session at 3.69%. Crude oil prices dropped $1.64 to $85.28 per barrel. The dollar was relatively flat, while gold prices continued to surge, advancing for the third consecutive session.
Last Thursday, Wall Street notched its second consecutive day of losses for the first time in two weeks. Investors’ hopes for a softening of the government’s policy to fight inflation were dampened by hawkish statements from senior Federal Reserve officials suggesting more aggressive interest-rate hikes. Each of the benchmark indexes closed lower, with the Russell 2000 falling the furthest, dropping 0.8%. The Global Dow and the Nasdaq slid 0.4%, the S&P 500 lost 0.3%, while the Dow was flat. Crude oil prices declined $3.62, hitting $81.97 per barrel — its lowest price since early October. Ten-year Treasury yields rose to 3.77%. The dollar advanced marginally, while gold prices fell for the first time in more than a week.
Stocks rebounded last Friday as each of the benchmark indexes listed here posted gains. The Dow and the Russell 2000 rose 0.6%, the Global Dow and the S&P 500 added 0.5%, while the Nasdaq was flat. Ten-year Treasuries rose 4.3 basis points to close the session and last week at 3.81%. Crude oil prices continued to decline, falling $1.44 to $80.20 per barrel. The dollar rose marginally, while gold prices decreased.
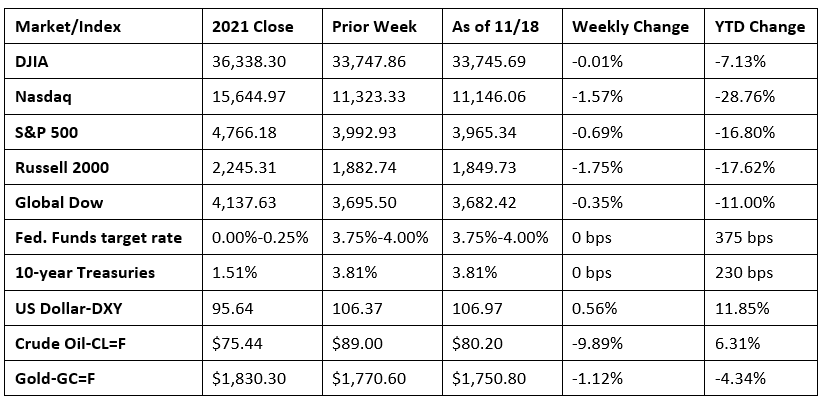
Chart reflects price changes, not total return. Because it does not include dividends or splits, it should not be used to benchmark performance of specific investments.
Last Week’s Economic News
- Prices U.S. producers received for goods and services rose 0.2% in October, the same increase as in September. Producer prices advanced 8.0% for the 12 months ended in October. Producer prices for goods rose 0.6% last month, the largest advance since a 2.2% increase in June. Most of the October increase can be traced to a 2.7% jump in prices for energy, driven higher by a 5.7% increase in gasoline prices. Prices for foods advanced 0.5%. Conversely, prices for goods less foods and energy decreased 0.1%. Producer prices for services declined 0.1% in October, the first decrease since November 2020.
- Import and export prices declined in October for the fourth consecutive month. International trade prices haven’t increased since June 2022. Import prices fell 0.2% in October following a 1.1% decline in September. Export prices declined 0.3% last month after falling 1.5% in September. Since October 2021, import prices have risen 4.2%, while export prices increased 6.9%. Annual price increases for both import and export prices are down notably from their respective 2022 high points of 13.0% and 18.6%. This data is another indication that inflationary pressures may have peaked.
- Retail sales increased 1.3% in October and 8.3% since October 2021. Retail trade sales were up 1.2% from September and 7.5% from October 2021. In October, gasoline station sales rose 4.1%, sales at food and beverage stores increased 1.4%, and sales at food services and drinking places climbed 1.6%.
- Industrial production slid 0.1% in October, while its September increase was revised down to 0.1%. Manufacturing rose 0.1% last month, while mining fell 0.4% and utilities dropped 1.5%. Nevertheless, industrial production in October was 3.3% above its October 2021 reading. Over the past 12 months, manufacturing was 2.4% above its year-earlier level, mining rose 3.6%, and utilities increased 2.6%.
- The number of residential building permits issued in October fell 2.4% from the previous month and is 10.1% below the October 2021 rate. Issued building permits for single-family homes declined 3.6% in October. The number of housing starts decreased 4.2% last month and 8.8% lower than the October 2021 rate. Single-family housing starts in October slid 6.1% under the September pace. In October, housing completions also lagged, falling 6.4% below the September rate but 6.6% above the October 2021 rate. Single-family home completions in October were 8.3% below the September rate.
- Sales of existing homes retreated for the ninth consecutive month in October after decreasing 5.9% from the September rate. Over the 12 months ended in October, existing home sales have fallen 28.4%. According to the report from the National Association of Realtors®, higher mortgage interest rates are making it harder for some potential homebuyers to qualify for loans, squeezing them out of the market. Relatively scant inventory is also impacting sales of existing homes. Total unsold inventory sat at a 3.3-month supply in October, up from 3.1 months in September. The median price for existing homes in October was $379,100, 1.2% below the September price of $383,500 but 6.6% above the October 2021 price ($355,700). Sales of existing single-family homes also declined in October, dropping 6.4% from September and 28.2% from October 2021. The median existing single-family home price was $384,900 in October, 1.2% under the September price ($389,600) but 6.2% above the October 2021 price ($362,600).
- According to the U.S. Energy Administration, the national average retail price for regular gasoline was $3.762 per gallon on November 14, $0.034 per gallon below the prior week’s price but $0.363 higher than a year ago. Also as of November 14, the East Coast price increased $0.021 to $3.611 per gallon; the Gulf Coast price decreased $0.049 to $3.137 per gallon; the Midwest price fell $0.099 to $3.677 per gallon; the West Coast price dropped $0.021 to $4.924 per gallon; and the Rocky Mountain price decreased $0.047 to $3.713 per gallon. Residential heating oil prices averaged $5.794 per gallon on November 14, $0.108 below the previous week’s price but $2.386 per gallon more than a year ago.
- For the week ended November 12, there were 222,000 new claims for unemployment insurance, a decrease of 4,000 from the previous week’s level, which was revised up by 1,000. According to the Department of Labor, the advance rate for insured unemployment claims for the week ended November 5 remained at 1.0%. The advance number of those receiving unemployment insurance benefits during the week ended November 5 was 1,507,000, an increase of 13,000 from the previous week’s level, which was revised up by 1,000. States and territories with the highest insured unemployment rates for the week ended October 29 were Puerto Rico (2.1%), California (1.8%), Alaska (1.7%), New Jersey (1.7%), Rhode Island (1.4%), New York (1.3%), Massachusetts (1.2%), Nevada (1.1%), Washington (1.1%), and Oregon (1.1%). The largest increases in initial claims for unemployment insurance for the week ended November 5 were in Kentucky (+3.453), California (+3,413), Texas (+2,415), Indiana (+1,228), and Illinois (+1,045), while the largest decreases were in Oregon (-1,276), New Jersey (-490), Florida (-391), Hawaii (-323), and Puerto Rico (-297).
Eye on the Week Ahead
There isn’t much in terms of economic data scheduled for Thanksgiving week. The October figures on durable goods orders are available. New orders for durable goods increased 0.4% in September, driven higher by new orders for transportation equipment. Excluding transportation, new orders for durable goods dipped 0.5% in September. The latest data on new home sales from the Census Bureau is out this week. Sales of new single-family homes fell nearly 11.0% in September and were down 17.6% since September 2021.
The Week Ahead

The information provided is obtained from sources believed to be reliable. Forecasts cannot be guaranteed. Past performance is not a guarantee of future results.
© 2021 Broadridge Financial Solutions, Inc. All Rights Reserved.