Stocks couldn’t maintain momentum from the previous two weeks, ultimately closing last week in the red. The small caps of the Russell 2000 gave back over 5.0%, while the Nasdaq dropped 4.0%. The S&P 500 fell 3.4%, the Dow declined 2.8%, and the Global Dow dipped 1.7%. Ten-year Treasury yields gained 6.0 basis points, and the dollar inched higher. Crude oil prices fell nearly 11.0%, closing at about $71.50 per barrel, which is below their 2021 closing values. Investors reacted poorly to a higher-than-expected producer price index last Friday and may anticipate a similar result when the consumer price index is released early this week.
Wall Street got off to a rough start last Monday as stocks suffered their worst daily decline in nearly a month. Energy and tech shares closed lower, helping to drag down the benchmark indexes listed here. The small caps of the Russell 2000 fell 2.8%, the Nasdaq lost 1.9%, the S&P 500 dropped 1.8%, the Dow dipped 1.4%, and the Global Dow declined 0.9%. Yields on 10-year Treasuries rose 9.3 basis points to 3.75%. Crude oil prices declined nearly 3.3%, falling to $77.33 per barrel. The dollar advanced, while gold prices lost 1.6% to close the session at $1,780.50 per ounce.
Stocks continued to trend lower last Tuesday. The Nasdaq dropped 2.0%, followed by the Russell 2000 (-1.5%) and the S&P 500 (-1.4%). The Dow and the Global Dow fell 1.0%. Crude oil prices declined 3.4%, hitting $74.33 per barrel even with OPEC+ countries cutting production and China tentatively easing COVID restrictions. The yield on 10-year Treasuries declined 8.6 basis points to 3.51%. The dollar inched higher, while gold prices rebounded.
Last Wednesday saw stocks close generally lower for the third consecutive day. Once again, the Nasdaq led the declines in the benchmark indexes, falling 0.5%. The Global Dow and the Russell 2000 lost 0.3%, while the S&P 500 lost for the fifth straight day after sliding 0.2%. The Dow ended the day flat. Crude oil prices, 10-year Treasury yields, and the dollar lost value. Crude oil prices fell to $72.40 per barrel, the lowest closing price since late December 2021. The yield on 10-year Treasuries declined 10.5 basis points to hit 3.40%. The dollar slipped marginally, down 0.42% against a basket of currencies. Gold prices rose $17.60 to $1,800.00 per ounce.
Wall Street rebounded last Thursday, likely attributable to bargain hunters and dip buyers. Tech shares moved higher, helping to drive the Nasdaq up 1.1%. The S&P 500 rose 0.8%, ending its longest losing streak in two months. The Russell 2000 added 0.6%, while the Dow and the Global Dow gained 0.6% and 0.5%, respectively. Ten-year Treasury yields climbed higher for the first time in the last three sessions, gaining 8.3 basis points to hit 3.49%. Crude oil prices slid lower, ending the session at about $71.84 per barrel. The dollar declined, while gold prices inched higher.
A late move away from risk pulled stocks lower last Friday as bond yields surged. The Dow dropped 0.9%, followed by the Nasdaq and the S&P 500, which lost 0.7%. The Russell 2000 led the declining indexes listed here, falling 1.2%. The Global Dow managed to break even. Ten-year Treasury yields added 7.6 basis points to reach 3.56%. Crude oil eked out a minimal gain. The dollar and gold prices advanced.
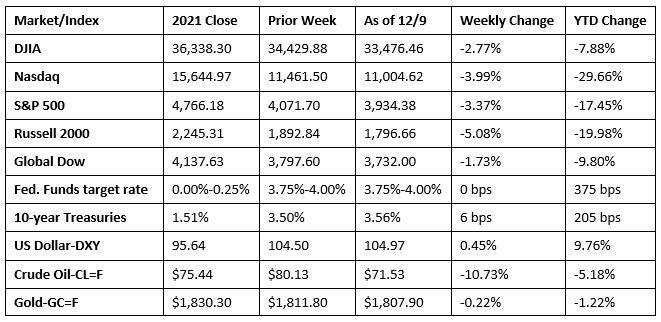
Chart reflects price changes, not total return. Because it does not include dividends or splits, it should not be used to benchmark performance of specific investments.
Last Week’s Economic News
- Prices producers received for goods and services sold rose 0.3% in November, the same increase as in October and September. For the 12 months ended in November, producer prices have risen 7.4%, down from 8.0% over the 12 months ended in October. In November, producer prices rose 0.4% excluding food and energy, and 0.3% excluding food, energy, and trade services. For the year ended in November, producer prices excluding food and energy rose 6.2%, down from 6.7% for the year ended in October. For the third month in a row, prices for services accounted for most of the overall producer price increase in November. Prices for services climbed 0.4%, while prices for goods inched up 0.1%.
- Business activity in the services sector contracted for the second consecutive month in November. The S&P Global US Services PMI Business Activity Index registered 46.2 in November, down from 47.8 in October. A reading of 50 or above indicates business growth. A decline in new orders and client demand led to the decrease in business activity for service providers. The rate of contraction is the fastest since August. Although firms remained keen to pass on higher costs to clients through a further hike in selling prices during November, the pace of increase moderated.
- The international trade in goods and services report, released December 6, is for October. The goods and services trade deficit advanced $78.2 billion, or 5.4%, in October. Exports declined 0.7%, while imports rose 0.6%. The October increase in the goods and services deficit reflected an increase in the goods deficit of $6.1 billion and an increase in the services surplus of $2.1 billion. Year to date, the goods and services deficit increased $136.9 billion, or 19.9%, from the same period in 2021. Both imports and exports increased 19.8%. The third-quarter figures show goods and services surpluses, in billions of dollars, with South and Central America ($28.2), Netherlands ($15.2), Singapore ($11.6), Brazil ($7.6), Australia ($7.1), Hong Kong ($6.8), United Kingdom ($6.4), Switzerland ($5.4), Belgium ($2.0), and Ireland ($0.3). Deficits were recorded with China ($94.9), Mexico ($35.2), Vietnam ($29.4), European Union ($25.6), Germany ($17.8), Canada ($15.0), Japan ($13.9), Taiwan ($13.0), India ($11.1), Italy ($10.5), South Korea ($9.0), Malaysia ($8.8), France ($2.7), Israel ($2.6), and Saudi Arabia ($0.5).
- According to the U.S. Energy Administration, the national average retail price for regular gasoline was $3.390 per gallon on December 5, $0.144 per gallon below the prior week’s price but $0.049 higher than a year ago. Also as of December 5, the East Coast price decreased $0.114 to $3.354 per gallon; the Gulf Coast price fell $0.107 to $2.808 per gallon; the Midwest price declined $0.162 to $3.212 per gallon; the West Coast price dropped $0.223 to $4.369 per gallon; and the Rocky Mountain price decreased $0.135 to $3.404 per gallon. Residential heating oil prices averaged $4.861 per gallon on December 5, $0.281 below the previous week’s price but $1.540 per gallon more than a year ago.
- Claims for unemployment insurance edged higher during the last reporting period. For the week ended December 3, there were 230,000 new claims for unemployment insurance, an increase of 4,000 from the previous week’s level, which was revised up by 1,000. According to the Department of Labor, the advance rate for insured unemployment claims for the week ended November 26 increased 0.1 percentage point to 1.2%. The advance number of those receiving unemployment insurance benefits during the week ended November 26 was 1,671,000, an increase of 62,000 from the previous week’s level, which was revised up by 1,000. States and territories with the highest insured unemployment rates for the week ended November 19 were Alaska (2.0%), Puerto Rico (1.8%), New Jersey (1.7%), California (1.6%), Montana (1.5%), New York (1.4%), Massachusetts (1.3%), Rhode Island (1.3%), Nevada (1.2%), and Oregon (1.2%). The largest increases in initial claims for unemployment insurance for the week ended November 26 were in Wisconsin (+1,542), Connecticut (+817), Ohio (+578), Tennessee (+278), and Massachusetts (+130), while the largest decreases were in California (-11,198), Illinois (-4,968), Georgia (-4,632), Texas (-4,611), and Florida (-2,425).
Eye on the Week Ahead
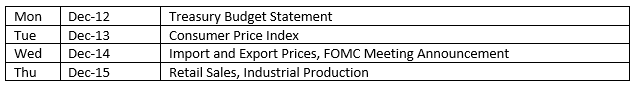
This week, the Federal Open Market Committee meets for the last time in 2022. While there’s no doubt the FOMC will hike interest rates in its ongoing effort to slow rising inflation, will the Committee scale back the increase to 50 basis points? The results of the November CPI, which is released during the FOMC meeting, may provide some indication of the course the Committee may take in December and over the next few months.
The Week Ahead
The information provided is obtained from sources believed to be reliable. Forecasts cannot be guaranteed. Past performance is not a guarantee of future results.
© 2021 Broadridge Financial Solutions, Inc. All Rights Reserved.