Stocks advanced for the second week in a row to kick off 2023. Investors were encouraged by inflation data that showed prices slid lower in December. The interest-rate-sensitive Nasdaq posted gains for six consecutive sessions, its longest streak since 2021, while the Nasdaq and the S&P 500 enjoyed their biggest weekly gains in nearly two months. China’s economic reopening boosted prospects for increased energy demand, sending crude oil prices higher. The dollar declined last week, which helped gold prices surge to the highest level since April.
Last Monday saw stocks end the day with mixed results. Among the benchmark indexes listed here, the Nasdaq and the Global Dow gained 0.6%, while the Russell 2000 advanced 0.2%. The large caps of the Dow (-0.3%) and the S&P 500 (-0.1%) ended the session lower after trending up most of the day. Investors’ hopes for a softening of interest-rate hikes were dampened by a few Federal Reserve officials who suggested that interest rates could hit 5.0%. Bond prices advanced pulling yields lower, with 10-year Treasury yields falling 5.2 basis points to 3.51%. Crude oil prices rose to $74.81 per barrel. The dollar slid lower, while gold prices rose more than a quarter of a percent to $1,875.70 per ounce.
Stocks jumped higher last Tuesday on hopes that the consumer price index for December will show further softening, which could prompt the Federal Reserve to slow the pace of its interest-rate hikes. The Russell 2000 led the benchmark indexes, gaining 1.5%, followed by the Nasdaq (1.0%), the S&P 500 (0.7%), the Dow (0.6%), and the Global Dow (0.2%). As stock values rose, bond prices fell, pushing yields higher, with 10-year Treasury yields adding 10.4 basis points to close at 3.62%. Crude oil prices changed little from the previous day. The dollar and gold prices advanced.
Equities advanced last Wednesday for a second consecutive day as investors seemed to be betting that inflation would continue to soften, strengthening the case for a Federal Reserve pullback on interest-rate hikes. The Nasdaq led the benchmark indexes, gaining 1.8%. The S&P 500 jumped 1.35, followed by the Russell 2000 (1.1%), the Dow (0.8%), and the Global Dow (0.7%). Ten-year Treasury yields fell 6.7 basis points to 3.55%. Crude oil prices rose 3.4% to $77.65 per barrel, supported by expectations of stronger demand from China. The dollar inched higher, while gold prices continued to rally, adding $4.10 per ounce to reach $1,880.60 per ounce.
Not surprisingly, investors were encouraged after the release of the latest consumer price index (see below). Stocks advanced for the third consecutive day last Thursday, led by the Russell 2000 (1.7%) and the Global Dow (1.4%). The Dow and the Nasdaq rose 0.6%, while the S&P 500 gained 0.3%. Ten-year Treasury yields fell 10.5 basis points to 3.44%. Crude oil prices rose to $78.34 per barrel. The dollar edged lower, while gold prices climbed higher, hitting $1,900.80 per ounce.
Stocks continued their rally last Friday. The Nasdaq and the Global Dow gained 0.7%, while the Russell 2000 rose 0.6%, the S&P 500 advanced 0.4%, and the Dow climbed 0.3%. Ten-year Treasury yields added 6.2 basis points to close at 3.51%. Crude oil prices advanced $1.57 to reach $79.96 per barrel. The dollar slipped for the second consecutive day, while gold prices vaulted up 1.3% to $1,921.90 per ounce.
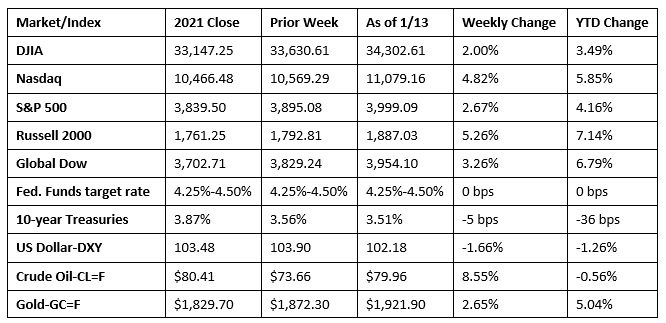
Chart reflects price changes, not total return. Because it does not include dividends or splits, it should not be used to benchmark performance of specific investments.
Last Week’s Economic News
- Good news on the inflation front. The December consumer price index fell 0.1%. Excluding food and energy, the CPI rose 0.3% last month. In December, prices for food rose 0.3% (0.5% in November), energy prices fell 4.5% (-1.6% in November), while prices for shelter rose 0.8% (0.6% in November). Over the last 12 months ended in December, the CPI has increased 6.5%, the smallest increase since the period ended in October 2021. For the 12 months ended in December, core prices (less food and energy) rose 5.7%, energy prices increased 7.3%, and food prices advanced 10.4%. All of these increases were smaller than for the 12-month period ended in November.
- Import prices rose 0.4% in December after declining 0.6% in November. Export prices fell 2.6%, following a 0.3% drop the previous month. The increase in import prices was the first since June 2022. Import prices increased 3.5% since December 2021. Fuel import prices rose 0.6% in December, while nonfuel prices increased 0.4%. Export prices haven’t increased since June 2022. Prices for exports rose 5.0% for the 12 months ended in December, the smallest 12-month advance since January 2021.
- The Treasury budget deficit for December was $85.0 billion, well above the $21.0 billion deficit of a year ago but well under the November deficit of $248.5 billion. For the first three months of the 2023 fiscal year, the deficit sat at $421.4 billion, up from $377.7 billion over the same period in fiscal year 2022. Compared to the same period last fiscal year, government expenditures increased $17.4 billion, while government receipts are down $26.3 billion.
- According to the U.S. Energy Administration, the national average retail price for regular gasoline was $3.259 per gallon on January 9, $0.036 per gallon above the prior week’s price but $0.036 lower than a year ago. Also, as of January 9, the East Coast price increased $0.006 to $3.216 per gallon; the Gulf Coast price dipped $0.001 to $2.890 per gallon; the Midwest price climbed $0.095 to $3.145 per gallon; the West Coast price increased $0.022 to $3.961 per gallon; and the Rocky Mountain price advanced $0.079 to $3.122 per gallon. Residential heating oil prices averaged $4.545 per gallon on January 9, $0.118 below the previous week’s price but $1.085 per gallon more than a year ago. Looking ahead, U.S. crude oil production is forecast to reach record highs in 2023 (12.4 million barrels per day) and 2024 (12.8 million barrels per day), which would surpass the previous annual record high of 12.3 million barrels per day.
- For the week ended January 7, there were 205,000 new claims for unemployment insurance, a decrease of 1,000 from the previous week’s level, which was revised up by 2,000. According to the Department of Labor, the advance rate for insured unemployment claims for the week ended December 31 was 0.1%, a decrease of one percentage point from the previous week’s rate. The advance number of those receiving unemployment insurance benefits during the week ended December 31 was 1,634,000, a decrease of 63,000 from the previous week’s level, which was revised up by 3,000. States and territories with the highest insured unemployment rates for the week ended December 24 were Alaska (2.3%), New Jersey (2.2%), Minnesota (2.2%), California (2.0%), Montana (2.0%), Rhode Island (2.0%), Puerto Rico (1.9%), Massachusetts (1.9%), Washington (1.8%), Illinois (1.7%), and New York (1.7%). The largest increases in initial claims for unemployment insurance for the week ended December 31 were in New Jersey (+4,514), Michigan (+3,322), New York (+3,169), Massachusetts, (+2,670), and Pennsylvania (+2,401), while the largest decreases were in Kentucky (-3,808), Illinois (-3,439), Texas (-3,252), Missouri (-2,882), and Minnesota (-880).
Eye on the Week Ahead
There’s plenty of potentially market-moving economic data out this week. The producer price index, which measures the change in prices from the perspective of the seller of goods and services, is an important inflation indicator. Producer prices rose 0.3% in November and were up 7.4% for the year. The retail sales report for December is also out this week. Retail sales fell 0.6% in November. The Federal Reserve’s report on industrial production for December is on tap for release this week. Industrial production slid 0.2% in November. The housing sector waned for much of 2022. The December figures for housing starts, completions, and issued building permits are available this week as is the December report on existing home sales.
The Week Ahead

The information provided is obtained from sources believed to be reliable. Forecasts cannot be guaranteed. Past performance is not a guarantee of future results.
© 2021 Broadridge Financial Solutions, Inc. All Rights Reserved.