Investors spent much of last week contemplating the impact of the latest inflation data and the first batch of first-quarter bank earnings. The process of disinflation continued, and retail sales softened in March, which are developments that could influence interest-rate decisions to be made by the Federal Reserve in the coming months. The stock market closed out the week with gains across the board, despite a couple of rough patches. The Global Dow increased 1.6%, followed by the Russell 2000 (1.5%), the Dow (1.2%), the S&P 500 (0.8%), and the Nasdaq (0.3%). Ten-year Treasury yields moved up 24 basis points. The dollar weakened against a basket of currencies, oil prices dipped, and gold prices were little changed.
Last week began with stocks moving generally higher. The Russell 2000 (1.0%), the Dow (0.3%), and the S&P 500 (0.1%) gained ground, while the Nasdaq was flat. The Global Dow slipped 0.2% lower. The yield on 10-year Treasuries climbed 12.7 basis points to 3.41%. Crude oil dipped about 1.0% to $79.85 per barrel. The dollar gained nearly 1.0%, while gold prices fell by 1.0%. Investors remained cautious, possibly anticipating another interest-rate hike from the Federal Reserve, particularly following the previous week’s solid jobs report.
Stocks notched another low-volume trading session last Tuesday. Tech shares lagged for the second consecutive day. Large caps fared better, with the Dow up 0.3%. The S&P 500 ended the day where it began, while the small caps of the Russell 2000 rose 0.8%. The Global Dow gained 0.7%. Ten-year Treasury yields inched up 1.9 basis points to 3.43%. Crude oil prices advanced to $81.47 per barrel. The dollar slid lower, while gold prices gained to remain above $2,000.00 per ounce for the sixth straight session.
After trading higher for much of the day, stocks weren’t able to maintain that momentum, ultimately closing lower last Wednesday. A slowdown in the latest Consumer Price Index wasn’t enough to calm cautious investors. The minutes of the last meeting of the Federal Open Market Committee, released last Wednesday, revealed that Fed officials agreed that another rate hike was needed, despite concerns that raising interest rates may cause more financial stress, particularly in light of the recent failure of two regional banks. By the close of trading, only the Global Dow posted a gain (0.3%). Tech shares declined for the third straight session, dragging the Nasdaq down 0.9%. The Russell 2000 fell 0.7%, the S&P 500 slid 0.4%, and the Dow dipped 0.1%. The yield on 10-year Treasuries slipped marginally, closing at 3.42%. Crude oil prices rose 2.0% to $83.24 per barrel. Gold prices gained nearly 0.5%, while the dollar dipped 0.6%.
Wall Street bounced back last Thursday after the producer price index provided more evidence that inflation is continuing to ease. The Nasdaq led the increase, climbing 2.0%, followed by the Russell 2000 and the S&P 500, each rising 1.3%. The Dow (1.1%) and the Global Dow (0.8%) also closed higher. Communication services and consumer discretionary led the market sectors, both moving up 2.3%. Ten-year Treasury yields ticked up to 3.45%. The dollar slipped and gold prices advanced 1.5%. Crude oil prices dropped 1.1% to $82.32 per barrel.
On Friday, all of the stock indexes listed here ended the day in the red. The Russell 2000 lost 0.9%, followed by the Dow and the Nasdaq, which both fell 0.4%. The S&P 500 ticked down 0.2% and the Global Dow was flat. The yield on 10-year Treasuries rose 7.0 basis points to 3.52%. Crude oil prices and the dollar moved marginally higher, while gold prices retreated from Thursday’s near-record level.
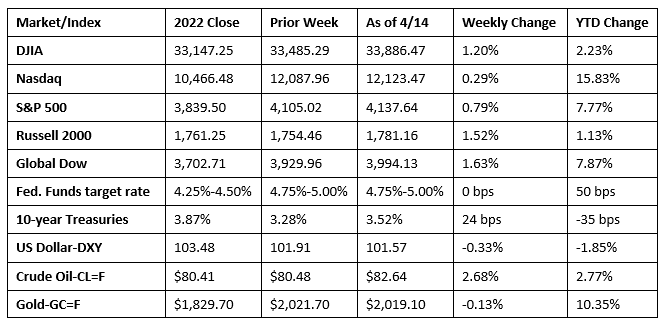
Chart reflects price changes, not total return. Because it does not include dividends or splits, it should not be used to benchmark performance of specific investments.
Last Week’s Economic News
- Consumer prices inched up 0.1% in March after advancing 0.4% in February, according to the latest Consumer Price Index. Over the last 12 months, the CPI has risen 5.0%, a decrease of 1.0% from the 12 months ended in February. This is the smallest 12-month increase since the 12 months ended in May 2021. As has been the case in prior months, prices for shelter (+0.6%) were by far the largest contributors to the monthly increase in the CPI. Those prices were more than offset by a decline in energy prices, which decreased 3.5%. Consumer prices less food and energy rose 0.4% in March after increasing 0.5% in February. In addition to prices for shelter, March also saw prices increase for motor vehicle insurance, airline fares, household furnishings and operations, and new vehicles. Prices for medical care and for used cars and trucks were among those that decreased over the month. While the March data is encouraging, it may not be enough to forestall another interest-rate hike when the Federal Open Market Committee next meets at the beginning of May.
- Producer prices declined 0.5% in March after being unchanged in February. The March decrease was the largest monthly drop since April 2020. For the 12 months ended in March, producer prices have increased 2.7%, the smallest 12-month increase since January 2021. Excluding food and energy, producer prices edged down 0.1% in March, however, when also excluding trade services, producer prices inched up 0.1%. Producer prices for goods decreased 1.0% in March, largely attributable to a 6.4% decline in energy prices, with gasoline prices falling 11.7%. Prices for food rose 0.6%. Prices for services declined 0.3%, while prices for trade services fell 0.9%.
- March saw inflationary pressures subside at the international trade level. Import prices decreased 0.6% last month, while export prices fell 0.3%. Lower prices for fuel and nonfuel imports each contributed to the March drop in U.S. import prices. Import prices declined 4.6% over the 12 months ended in March, and export prices declined 4.8%. Both of these year-over-year drops were the largest since May 2020.
- Retail sales fell 1.0% from the previous month in March but were up 2.9% since March 2022. Total sales for January 2023 through March 2023 were up 5.4% from the same period last year. Retail trade sales fell 1.2% from February but were up 1.5% year over year. Nonstore retailers were up 12.3% in March from the previous year, while food services and drinking places were up 13.0%.
- Industrial production rose 0.4% in March after increasing 0.9% and 0.2% in January and February, respectively. In March, manufacturing and mining output each fell 0.5%. The index for utilities jumped 8.4%, as the return to more seasonal weather after a mild February boosted the demand for heating. Total industrial production in March was 0.5% higher than a year earlier.
- The monthly government deficit expanded by $115.6 billion in March over the previous month, and $185.4 billion over the March 2022 deficit. For the current fiscal year, the government deficit sits at $1,100.7 trillion, $432.5 billion higher than the deficit over the comparable period in the previous fiscal year. In March, government receipts increased by $51.1 billion over February receipts, while expenditures rose by $166.8 billion.
- The national average retail price for regular gasoline was $3.596 per gallon on April 10, $0.099 per gallon more than the prior week’s price but $0.495 less than a year ago. Also, as of April 10, the East Coast price increased $0.104 to $3.461 per gallon; the Gulf Coast price advanced $0.105 to $3.253 per gallon; the Midwest price rose $0.127 to $3.516 per gallon; the Rocky Mountain price decreased $0.027 to $3.438 per gallon; and the West Coast price increased $0.061 to $4.457 per gallon. The U.S. Energy Information Administration forecasts that regular retail gas prices in the U.S. will average $3.49 per gallon during this summer (April through September). Household expenditures on gasoline are consistently the most expensive category of household spending directly related to energy. In 2021, the most recent year data was available in the U.S., the Bureau of Labor Statistics’ Consumer Expenditure Survey indicated that average annual household spending on gasoline totaled $2,148 — slightly more than electricity, natural gas, and fuel oil combined.
- For the week ended April 8, there were 239,000 new claims for unemployment insurance, an increase of 11,000 from the previous week’s level. According to the Department of Labor, the advance rate for insured unemployment claims for the week ended April 1 was 1.2%, a decrease of 0.1 percentage point from the previous week’s rate. The advance number of those receiving unemployment insurance benefits during the week ended April 1 was 1,810,000, a decrease of 13,000 from the previous week’s level. States and territories with the highest insured unemployment rates for the week ended March 25 were New Jersey (2.5%), California (2.3%), Massachusetts (2.3%), Rhode Island (2.2%), Minnesota (2.1%), Illinois (1.9%), New York (1.9%), Alaska (1.8%), Puerto Rico (1.8%), Connecticut (1.7%), Montana (1.7%), and Oregon (1.7%). The largest increases in initial claims for unemployment insurance for the week ended April 1 were in Indiana (+4,457), Illinois (+1,933), Massachusetts (+1,216), Oregon (+1,052), and South Carolina (+211), while the largest decreases were in California (-6,833), Kentucky (-3,907), Michigan (-3,281), Ohio (-2,494), and New York (-1,711).
Eye on the Week Ahead
We begin to get the latest data on the housing sector this week with the release of reports on housing starts and existing-home sales. Sales of existing homes soared in February, climbing over 14.0% from the previous month’s total. However, sales remained 22.6% under their February 2022 pace. Issued building permits and housing starts rose notably in February, a good sign for new-home construction heading into the spring.
The Week Ahead

The information provided is obtained from sources believed to be reliable. Forecasts cannot be guaranteed. Past performance is not a guarantee of future results.
© 2021 Broadridge Financial Solutions, Inc. All Rights Reserved.