Stocks began the week on a downturn, but rallied later to end last week higher. Each of the benchmark indexes listed here posted solid weekly gains, led by the Russell 2000, followed by the Nasdaq, the Dow, the S&P 500, and the Global Dow. Investors began the week concerned that the debt ceiling agreement between President Biden and House Speaker McCarthy would not pass the House and Senate. However, both chambers of Congress passed the debt ceiling bill later in the week, removing the risk of government default. In addition, investors may have been encouraged by a strong jobs report (see below), which is somewhat paradoxical as a strong labor market could support more interest rate hikes by the Federal Reserve. Nevertheless, Wall Street ended the week on a positive note. The Nasdaq rose for the sixth consecutive week, the longest weekly winning streak since January 2020. Despite a surge last Thursday and Friday, crude oil prices ended the week lower. The yield on 10-year Treasuries slipped lower, while the dollar changed little. Gold prices advanced nearly 1.0%.
Stocks were mixed last Tuesday following the Memorial Day holiday. Despite an apparent debt ceiling agreement between President Biden and House Speaker McCarthy, investors remained jittery ahead of a Congressional vote. The Nasdaq (0.3%) was the only benchmark index of those listed here to post a gain. The S&P 500 ended the session flat, the Russell 2000 and the Global Dow fell 0.3%, and the Dow dipped 0.2%. Ten-year Treasury yields dropped 11.0 basis points to close at 3.70%. The dollar dipped lower, while gold prices rose 0.8%. Crude oil prices declined 4.0% to $69.75 per barrel, impacted by debt ceiling worries and reported tensions between Saudi Arabia and Russia ahead of an important OPEC+ meeting.
Wall Street endured another sour day last Wednesday as investors remained concerned about the passage of the debt ceiling bill. In addition, the latest JOLTS report (see below) showed the number of job openings increased, raising the prospects of another interest rate hike by the Federal Reserve in June. The Global Dow fell 1.3%, likely impacted by China’s lackluster industrial production report. The Russell 2000 dipped 1.0%, the Nasdaq and the S&P 500 lost 0.6%, while the Dow slipped 0.4%. Bond prices jumped higher, pulling yields lower. Ten-year Treasury yields lost 6.3 basis points to close at 3.63%. Crude oil prices fell 2.5% to $67.71 per gallon. The dollar and gold prices advanced.
Equities advanced last Thursday as stocks kicked off June on an upswing, with each of the benchmark indexes listed here posting notable gains. No doubt investors were encouraged by the House’s passage of the debt ceiling bill. The Global Dow (1.5%) led the way, followed by the Nasdaq (1.3%), the Russell 2000 (1.1%), the S&P 500 (1.00%), and the Dow (0.5%). Ten-year Treasury yields continued to trend lower, falling 2.9 basis points to settle at 3.60%. Crude oil prices rebounded, climbing 3.1% to reach $70.18 per barrel. The dollar slid lower, while gold prices advanced 0.7%.
Stocks pushed higher last Friday on positive jobs data (see below) and the passage of the debt ceiling bill by Congress. The Russell 2000 jumped 3.6%, followed by the Dow (2.1%), which enjoyed its best day of the year. The Global Dow rose 1.7%, the S&P 500 advanced 1.5%, and the Nasdaq increased 1.1%. Ten-year Treasury yields closed at 3.69%. Crude oil prices increased 2.7% to $71.97 per barrel, the dollar edged higher, while gold prices declined.
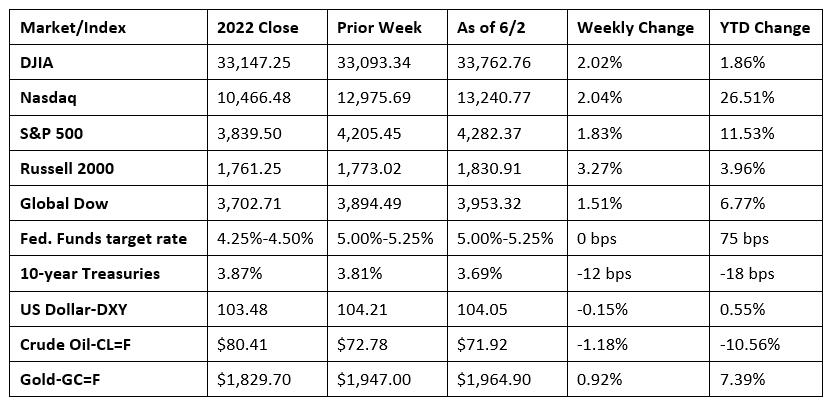
Chart reflects price changes, not total return. Because it does not include dividends or splits, it should not be used to benchmark performance of specific investments.
Last Week’s Economic News
- The labor sector remained strong in May. According to the latest data from the Bureau of Labor Statistics, there were 339,000 new jobs added in May, in line with the average monthly gain of 341,000 over the prior 12 months. In May, job gains occurred in professional and business services, government, health care, construction, transportation and warehousing, and social assistance. Despite the new hires, May saw the unemployment rate rise by 0.3 percentage point to 3.7%, and the number of unemployed persons increase by 440,000 to 6.1 million. The unemployment rate has ranged from 3.4% to 3.7% since March 2022. The labor force participation rate, at 62.6% has not changed over the past three months. The employment-population ratio dipped 0.1 percentage point to 60.3%. In May, average hourly earnings rose by $0.11, or 0.3%, to $33.44. Over the past 12 months, average hourly earnings have increased by 4.3%. The average workweek edged down by 0.1 hour to 34.3 hours in May.
- The number of job openings edged up 358,000 to 10.1 million in April. Job openings increased in retail trade, health care and social assistance, and transportation, warehousing, and utilities. In April, the number of hires changed little at 6.1 million. Total separations, which include quits, layoffs, discharges, and other separations, declined 286,000 to 5.7 million.
- Manufacturing slowed in May after expanding in April. The S&P Global US Manufacturing Purchasing Managers’ Index™ posted 48.4 in May, down from 50.2 in April. A reading under 50 indicates contraction. A reduction in new orders and muted overall demand slowed manufacturing. Despite the regression in demand, manufacturers increased output and employment, partly to fulfill existing backlogs of work, and to take advantage of a reduction in input costs to manufacturers, which fell for the first time since May 2020.
- The national average retail price for regular gasoline was $3.571 per gallon on May 29, $0.037 per gallon higher than the prior week’s price but $1.053 less than a year ago. Also, as of May 29, the East Coast price increased $0.046 to $3.427 per gallon; the Gulf Coast price rose $0.081 to $3.121 per gallon; the Midwest price increased $0.015 to $3.484 per gallon; the Rocky Mountain price advanced $0.043 to $3.622 per gallon; and the West Coast price climbed $0.020 to $4.534 per gallon.
- For the week ended May 27, there were 232,000 new claims for unemployment insurance, an increase of 2,000 from the previous week’s level, which was revised up by 1,000. According to the Department of Labor, the advance rate for insured unemployment claims for the week ended May 20 was 1.2%, unchanged from the previous week’s rate. The advance number of those receiving unemployment insurance benefits during the week ended May 20 was 1,795,000, an increase of 6,000 from the previous week’s level, which was revised down by 5,000. States and territories with the highest insured unemployment rates for the week ended May 13 were California (2.2%), New Jersey (2.1%), Massachusetts (2.0%), New York (1.6%), Oregon (1.6%), Puerto Rico (1.6%), Alaska (1.5%), Rhode Island (1.5%), Washington (1.5%), and Illinois (1.4%). The largest increases in initial claims for unemployment insurance for the week ended May 20 were in Texas (+2,808), Connecticut (+2,091), Iowa (+621), Pennsylvania (+540), and Missouri (+324), while the largest decreases were in Massachusetts (-2,127), Michigan (-1,024), Illinois (-1,000), New York (-625), and Oregon (-565).
Eye on the Week Ahead
There is very little economic data available during the first full week of June. The services purchasing managers’ index for May is available. April saw growth in the services sector, with new orders posting their best rate of growth since May 2022. Also out this week is the report on international trade in goods and services for April. March saw the trade deficit narrow by about $64.0 billion, as both imports and exports edged higher.
The Week Ahead

The information provided is obtained from sources believed to be reliable. Forecasts cannot be guaranteed. Past performance is not a guarantee of future results.
© 2021 Broadridge Financial Solutions, Inc. All Rights Reserved.