Wall Street closed last week with mixed results. The Nasdaq and the Russell 2000 closed lower, while the Dow, the S&P 500, and the Global Dow edged higher. Several big banks kicked off third-quarter earnings season with upbeat returns, which helped quell concerns over the developments in the Middle East. Inflation continued to prove stubborn, with data from September showing prices rose more than expected. Ten-year Treasury yields declined, while crude oil prices jumped over concerns about the potential impact of the Middle East conflict and tightened sanctions by the United States on sales of crude to Russia. Some analysts fear that the escalating struggle between Israel and Hamas might lead to soaring crude oil prices topping $150 per barrel to the detriment of global economic growth — not a good environment for stocks.
Wall Street saw stocks close higher last Monday, despite the conflict in the Middle East. Crude oil prices jumped higher on fears that some oil-producing countries could be pulled into the conflict. Each of the benchmark indexes listed here posted gains with the S&P 500 and the Dow gaining 0.6%. The Russell 2000 and the Global Dow rose 0.5%, while the Nasdaq added 0.4%. Defense and energy stocks were solid gainers. Crude oil prices settled at about $86.37 per barrel after climbing 4.3%. The yield on 10-year Treasuries ticked up 1.3 basis points to 4.79%. Gold prices rose 1.7%, while the dollar was flat.
Stocks continued to trend higher last Tuesday with the Nasdaq and the S&P 500 reaching their highest levels in over three weeks. Bond prices also rose, sending yields lower. The Global Dow gained 1.5%, the small caps of the Russell 2000 climbed 1.1%, the Nasdaq advanced 0.6%, the S&P 500 increased 0.5%, and the Dow added 0.4%. Ten-year Treasury yields fell 14.2 basis points to 4.65%. The dollar dipped 0.3%, while gold prices advanced 0.5%. Crude oil prices declined 0.6%, settling at about $85.83 per barrel.
Last Wednesday saw stocks advance for the fourth straight session. Of the benchmark indexes listed here, only the Russell 2000 (-0.7%) declined. The Nasdaq increased 0.7%, the S&P 500 gained 0.4%, while the Dow and the Global Dow rose 0.2%. Ten-year Treasury yields dipped 6.0 basis points to close at 4.59%. Crude oil prices fell 2.3%, to settle at about $84.02 per barrel. The dollar was little changed, while gold prices rose 0.6%.
Wall Street snapped a four-day winning streak last Thursday as stock values and bond prices slipped lower. Investors may have reacted to a slightly hotter-than-expected Consumer Price Index (see below). The small caps of the Russell 2000 took the biggest drop, falling 2.2%, while the Nasdaq, the S&P 500, and the Global Dow lost 0.6%. The Dow declined 0.5%. Ten-year Treasury yields climbed 11.7 basis points to 4.71%. The dollar gained 0.7%. Gold prices slid 0.3%. Crude oil prices were relatively unchanged, closing at about $83.47 per barrel.
Stocks fell and bond prices rose as investors retreated from stocks in response to the widening conflict in the Middle East. Gold prices rose the most since March, while crude oil prices rallied. Only the Dow was able to eke out a 0.1% advance last Friday. The Nasdaq dropped 1.2%, followed by the Russell 2000 and the Global Dow (-0.8%), while the S&P 500 dipped 0.5%. Crude oil prices shot up nearly 6.0%, settling at $87.76 per barrel. Ten-year Treasury yields fell 8.3 basis points to close at 4.62%. The dollar advanced marginally.
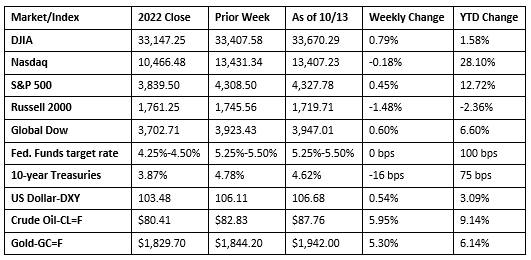
Chart reflects price changes, not total return. Because it does not include dividends or splits, it should not be used to benchmark performance of specific investments.
Last Week’s Economic News
- The Consumer Price Index rose 0.4% in September, after climbing 0.6% in August. Prices for shelter were the largest contributor to the monthly increase (+0.6%), accounting for over half of the increase. An increase in gasoline prices (+2.1%) was also a major contributor to the monthly rise. Prices for food ticked up 0.2% last month. Prices less food and energy rose 0.3% in September, the same increase as in August. Over the last 12 months, the CPI increased 3.7%, the same increase as the 12 months ended in August. The 12-month increase in prices less food and energy was 4.1%, down from 4.3% for the 12 months ended in August. Over the 12 months ended in September, energy prices decreased 0.5%, while food prices increased 3.7%.
- The prices producers received for goods and services rose 0.5% in September from the previous month. The September advance followed increases of 0.7% in August and 0.6% in July. Producer prices advanced 2.2% for the 12 months ended in September, the largest increase since moving up 2.3% for the 12 months ended in April. In September, prices for goods rose 0.9%, driven higher by a 3.3% rise in energy prices. Prices for services advanced 0.3%. Prices less foods, energy, and trade services increased 0.2% in September, the fourth consecutive advance. For the 12 months ended in September, prices less foods, energy, and trade services moved up 2.8%.
- Prices for U.S. imports ticked up 0.1% in September following a 0.6% advance the previous month. Higher fuel prices drove the September increase. Import fuel prices advanced 4.4% in September, after rising 8.8% in August. Import fuel prices have not recorded a one-month decline since May 2023. Prices for nonfuel imports decreased 0.2% for the second consecutive month in September. Despite the recent increases, prices for U.S. imports declined 1.7% for the year ended in September. U.S. export prices rose 0.7% in September after advancing 1.1% in August. Prices for agricultural exports fell 1.1% in September after decreasing 2.1% the previous month. Prices for nonagricultural exports rose 1.0% in September following a 1.5% increase the previous month. Prices for U.S. exports decreased 4.1% over the past year. The 12-month drop in September was the smallest 12-month decline since February 2023.
- The national average retail price for regular gasoline was $3.684 per gallon on October 9, $0.114 per gallon lower than the prior week’s price and $0.228 less than a year ago. Also, as of October 9, the East Coast price decreased $0.062 to $3.476 per gallon; the Midwest price fell $0.117 to $3.422 per gallon; the Gulf Coast price dropped $0.136 to $3.185 per gallon; the Rocky Mountain price declined $0.100 to $3.820 per gallon; and the West Coast price decreased $0.224 to $5.167 per gallon.
- For the week ended October 7, there were 209,000 new claims for unemployment insurance, unchanged from the previous week’s level, which was revised up by 2,000. According to the Department of Labor, the advance rate for insured unemployment claims for the week ended September 30 was 1.1%, unchanged from the previous week’s rate. The advance number of those receiving unemployment insurance benefits during the week ended September 30 was 1,702,000, an increase of 30,000 from the previous week’s level, which was revised up by 8,000. States and territories with the highest insured unemployment rates for the week ended September 23 were Hawaii (2.4%), California (2.1%), New Jersey (2.1%), Puerto Rico (1.9%), Massachusetts (1.6%), New York (1.6%), Oregon (1.5%), Rhode Island (1.5%), and Washington (1.5%). The largest increases in initial claims for unemployment insurance for the week ended September 30 were in California (+1,202), Texas (+453), Michigan (+409), Virginia (+331), and Indiana (+306), while the largest decreases were in Ohio (-1,528), Alabama (-794), Illinois (-492), Missouri (-470), and Colorado (-456).
Eye on the Week Ahead
This week includes the release of data on retail sales for September. Consumer spending at the retail level has been steady so far this year, with sales increasing 0.6% in August. The Federal Reserve’s report on industrial production for September is available this week. August saw industrial production increase 0.4%, although manufacturing output only ticked up 0.1%. Housing data is out this week with the release of the report on housing starts and building permits. Building permits increased 6.9% in August, while housing starts dipped 11.3%. September data on existing home sales is released at the end of this week. Rising interest rates and a dearth of inventory have caused sales of existing homes to fall 15.3% from a year earlier.
The Week Ahead

The information provided is obtained from sources believed to be reliable. Forecasts cannot be guaranteed. Past performance is not a guarantee of future results.
© 2021 Broadridge Financial Solutions, Inc. All Rights Reserved.