Stocks closed higher last week, with the S&P 500 and the Nasdaq reaching record highs. Investors were encouraged by generally favorable fourth-quarter corporate earnings data and a downwardly revised Consumer Price Index for December. Each of the benchmark indexes listed here gained ground, led by the Russell 2000 and the Nasdaq. Last week saw information technology, communication services, industrials, and consumer discretionary lead the market sectors, while utilities and consumer staples trended lower. Crude oil prices continued to rise last week amid ongoing Middle East tensions.
The week kicked off with stocks falling as bond yields advanced. The small caps of the Russell 2000 took the brunt of the downturn, giving back 1.3%, followed by the Dow (-0.7%), the Global Dow (-0.5%), the S&P 500 (-0.3%), and the Nasdaq (-0.2%). Yields on 10-year Treasuries gained 13.1 basis points to close at 4.16%. Crude oil prices gained 0.8%, settling at $72.82 per barrel. The dollar advanced 0.5%, while gold prices fell 0.6%.
Equities closed up last Tuesday following a selloff in the prior session. Materials and real estate were solid sectors, offsetting a decline by information technology. Among the benchmark indexes listed here, the Russell 2000 gained the most after adding 0.9%. The Global Dow rose 0.8%, the Dow advanced 0.4%, the S&P 500 climbed 0.2%, while the Nasdaq inched up 0.1%. Ten-year Treasury yields closed at 4.09% after falling 7.4 basis points. Crude oil prices rose roughly $0.70 to $73.48 per barrel. The dollar ticked lower, while gold prices rose 0.4%. With earnings season reaching the half-way mark, 75% of S&P 500 companies have reported actual earnings per share (EPS) above estimates. In aggregate, S&P 500 companies have exceeded estimates by 7.3%, leading to a net $16.0 billion increase in earnings for the fourth quarter since January 19.
Stocks climbed higher last Wednesday as investors chewed over another batch of corporate earnings. The Nasdaq gained 1.0% to lead the benchmark indexes listed here. The S&P 500 rose 0.8% to hit a new record high. The Dow added 0.4% and the Global Dow ticked up 0.2%. The small caps of the Russell 2000 dipped 0.2%. Yields on 10-year Treasuries inched up 2.0 basis points to 4.11%. Crude oil prices rose $0.76 to $74.07 per barrel. The dollar and gold prices declined.
Last Thursday saw the S&P 500 reach 5,000 for the first time in its history, only to close slightly below that mark. A strong performance from chip makers helped advance the Nasdaq by 0.2%. The Dow edged up 0.1%. The small caps of the Russell 2000 led the benchmarks, gaining 1.5%. Despite the gain, the Russell 2000 remains in bear territory (down by 20% from a prior peak in 2021). The Global Dow dipped 0.2%. Crude oil prices jumped $2.60 to $76.46 per barrel. Ten-year Treasury yields closed at 4.17% after gaining 6.0 basis points. The dollar ticked up 0.1%, while gold prices fell 0.1%.
Last Friday saw the S&P 500 (0.6%) top the 5,000 mark, while the Nasdaq (1.3%) closed at a record high. The Russell 2000 enjoyed a second solid day, adding 1.5%. The Global Dow was flat, while the Dow dipped 0.1%. Ten-year Treasury yields inched up 1.7 basis points to 4.18%. Crude oil prices increased $0.32 to $76.55 per barrel. The dollar and gold prices closed the session in the red.
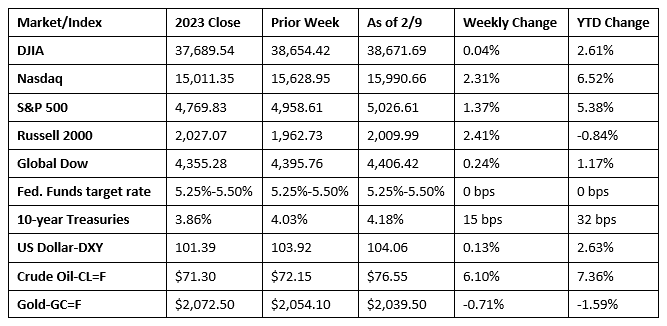
Chart reflects price changes, not total return. Because it does not include dividends or splits, it should not be used to benchmark performance of specific investments.
Last Week’s Economic News
- Business activity in the services sector expanded in January at the fastest pace since June 2023. New orders increased in both the domestic market and for exports. The increase in demand spurred more hirings by service firms. At the same time, inflationary pressures softened, with costs to service providers rising at the slowest pace since June 2020. The S&P Global US Services PMI Business Activity Index posted 52.5 in January, up from 51.4 in December. The latest reading marks the fourth straight month of expansion in the services sector.
- The latest data from the Bureau of Economic Analysis shows the December trade deficit was $62.2 billion, up $0.3 billion, or 0.5%, from the November deficit. December exports were $258.2 billion, $3.9 billion, or 1.5%, more than November exports. December imports were $320.4 billion, $4.2 billion, or 1.3%, more than November imports. For 2023, the goods and services deficit was $773.4 billion, a decrease of $177.8 billion, or 18.7%, from 2022. This is the lowest annual trade deficit in three years. Exports increased $35.0 billion, or 1.2%. Imports decreased $142.7 billion, or 3.6%.
- The national average retail price for regular gasoline was $3.136 per gallon on February 5, $0.041 per gallon higher than the prior week’s price but $0.308 per gallon less than a year ago. Also, as of February 5, the East Coast price increased $0.034 to $3.117 per gallon; the Midwest price rose $0.039 to $2.911 per gallon; the Gulf Coast price increased $0.068 to $2.821 per gallon; the Rocky Mountain price advanced $0.014 to $2.746 per gallon; and the West Coast price increased $0.046 to $3.983 per gallon.
- For the week ended February 3, there were 218,000 new claims for unemployment insurance, a decrease of 9,000 from the previous week’s level, which was revised up by 3,000. According to the Department of Labor, the advance rate for insured unemployment claims for the week ended January 27 was 1.2%, a decrease of 0.1 percentage point from the previous week’s rate. The advance number of those receiving unemployment insurance benefits during the week ended January 27 was 1,871,000, a decrease of 23,000 from the previous week’s level, which was revised down by 4,000. States and territories with the highest insured unemployment rates for the week ended January 20 were New Jersey (2.8%), Rhode Island (2.7%), Minnesota (2.6%), California (2.5%), Massachusetts (2.4%), Illinois (2.3%), Montana (2.3%), Alaska (2.2%), Oregon (2.1%), Pennsylvania (2.1%), and Washington (2.1%). The largest increases in initial claims for unemployment insurance for the week ended January 27 were in Oregon (+5,458), California (+5,015), New York (+4,133), Georgia (+1,032), and Texas (+900), while the largest decreases were in Illinois (-2,278), Missouri (-1,588), Massachusetts (-898), Montana (-717), and New Jersey (-507).
Eye on the Week Ahead
January inflation data is available this week with the release of the Consumer Price Index, the Producer Price Index, and the report on import and export prices. Consumer prices rose marginally in December, with the CPI increasing 0.3% for the month and 3.4% for the 12 months ended in December. Producer prices, on the other hand, ticked down 0.1% in December and were up only 1.0% for the year.
The Week Ahead

The information provided is obtained from sources believed to be reliable. Forecasts cannot be guaranteed. Past performance is not a guarantee of future results.
© 2021 Broadridge Financial Solutions, Inc. All Rights Reserved.