Rising inflation heightened investor concerns that the Federal Reserve may not consider lowering interest rates during the first half of the year. Among the benchmark indexes listed here, only the small caps of the Russell 2000 and the Global Dow were able to gain ground. The Dow snapped a five-week winning streak, while the Nasdaq and the S&P 500 also finished the week lower. With the stock market closed on Monday for President’s Day, investors will have to wait a little longer to try to begin another rally. Materials, utilities, financials, and industrials were better-performing sectors, while information technology and communication services lagged. Ten-year Treasury yields rose for the second straight week. Crude oil prices climbed higher, while the national average for regular gasoline jumped to a two-month high.
Last week began with what turned out to be a choppy day of trading. The Dow added 0.3% to hit a fresh record last Monday. The tech-heavy Nasdaq fell 0.3% and the S&P 500 dipped 0.1%. The small caps of the Russell 2000 jumped 1.8%, while the Global Dow gained 0.4%. Ten-year Treasury yields closed at 4.17%. Gold prices rose $0.17 to $77.01 per barrel. The dollar was flat while gold prices fell 0.2%.
Stocks closed sharply lower last Tuesday following a hotter-than-expected Consumer Price Index (see below). After reaching record highs, each of the benchmark indexes listed here declined. The small caps of the Russell 2000 fell 4.0%, the tech-heavy Nasdaq lost 1.8%, the Dow and the S&P 500 declined 1.4%, while the Global Dow dropped 0.9%. The latest inflation data probably prompted investors to reconsider their expectations of a rate cut by the Federal Reserve in March or May. Yields on 10-year Treasuries jumped 14.4 basis points to 4.31%. Crude oil prices advanced, gaining $0.88 to $77.80 per barrel. The dollar rose 0.7%, while gold prices decreased 1.3%.
Last Wednesday saw stocks rebound from the prior day’s selloff. The Russell 2000 gained 2.4%, followed by the Nasdaq, which added 1.3%. The S&P 500 rose 1.0%, while the Dow and the Global Dow advanced 0.4%. Ten-year Treasury yields declined 4.9 basis points to 4.26%. Crude oil prices fell $1.37 to $76.60 per barrel, The dollar and gold prices slid lower.
Stocks continued to climb higher last Thursday led by the Russell 2000, which gained 2.5%. Investors assessed a slew of favorable corporate earnings centered around information technology, consumer spending, and energy. The Dow and the Global Dow added 0.9%, while the S&P 500 rose 0.6% and the Nasdaq advanced 0.3%. Ten-year Treasury yields dipped to 4.24%. Crude oil prices rose to $78.20 per barrel, up about $1.56 from the prior day’s close. The dollar fell 0.4%, while gold prices rose 0.6%.
Most of the benchmark indexes listed here lost ground last Friday. The Global Dow proved to be the exception, eking out a 0.1% gain. The Russell 2000 fell 1.4%, the Nasdaq dropped 0.8%, the S&P 500 declined 0.5%, and the Dow slipped 0.4%. Ten-year Treasury yields added 5.5 basis points to close at 4.29%. Crude oil prices gained 1.5% to settle just shy of $80.00 per barrel. The dollar was flat, while gold prices rose 0.5%.
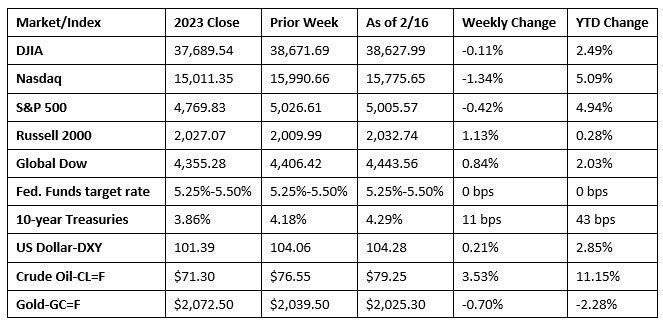
Chart reflects price changes, not total return. Because it does not include dividends or splits, it should not be used to benchmark performance of specific investments.
Last Week’s Economic News
- The Consumer Price Index rose 0.3% in January, exceeding expectations with the largest monthly gain since September 2023. Core prices, excluding food and energy, rose 0.4% in January, 0.1 percentage point higher than the December increase. Despite the January increase, the 12-month rate declined from 3.4% to 3.1%, while core prices were unchanged at 3.9%. Prices for shelter, which rose 0.6% last month, contributed more than two thirds of the overall monthly increase. Food prices advanced 0.4%, while energy prices fell 0.9%. In addition to food and shelter, other areas which saw prices increase included motor vehicle insurance and medical care. Prices for used cars and trucks and for apparel were among those that decreased over the month. For the 12 months ended in January, prices for food rose 2.6% and shelter prices advanced 6.0%. Prices for energy declined 4.6%.
- The Producer Price Index rose 0.3% in January after falling 0.1% in December. Since January 2023, producer prices have risen 0.9%. Last month, producer prices for services advanced 0.6%, the largest increase since July 2023. Prices for goods declined 0.2%. Producer prices less foods, energy, and trade services rose 0.6% in January, the largest advance since moving up 0.6% in January 2023. For the 12 months ended January 2024, prices for final demand less foods, energy, and trade services increased 2.6%.
- Retail sales declined 0.8% in January from the previous month but were up 0.6% from January 2023. Retail trade sales were down 1.1% from December 2023 and 0.2% below sales from a year earlier. Nonstore (online) retail sales were up 6.4% from last year, while sales at food services and drinking places were up 6.3% from January 2023.
- Both import prices and export prices rose 0.8% in January after declining 0.7% in December. The January increase in import prices was the first monthly advance since September 2023 and was the largest monthly increase since March 2022. Despite the January increase, import prices fell 1.3% over the past year and have not risen on a 12-month basis since January 2023. Import fuel prices increased 1.2% in January following declines of 7.7% in December and 6.3% in November. The January increase in export prices was also the first monthly increase since September 2023. Over the past 12 months ended in January, export prices decreased 2.4%.
- Industrial production edged down 0.1% in January after recording no change in December. Manufacturing output declined 0.5% last month after increasing in both November and December. Mining fell 2.3%, while an increased demand for heating drove utilities up 6.0%. Total industrial production was identical to its year-earlier level. Within the manufacturing sector, durables edged up 0.1% in January, which was more than offset by manufacturing of nondurables, which fell 1.1%.
- The Treasury budget deficit was $22.0 billion in January, down from December’s $129.4 billion. January receipts were $477.3 billion, while expenditures were $499.3 billion. Through the first four months of the current fiscal year, the deficit sat at $531.9 billion, about $72.0 billion above the deficit over the same period last fiscal year. Last month, individual income taxes ($283.0 billion) contributed more than half of the total receipts, while Social Security and Medicare payments ($204.0 billion) represented the largest expenditures.
- The number of building permits issued for residential construction decreased 1.5% in January from December but were 8.6% above the January 2023 figure. Building permits for single-family residential construction increased 1.6% last month. Housing starts fell 14.8% in January and were 0.7% under the January 2023 rate. Single-family housing starts also declined, falling 4.7%. January home completions were 8.1% below the December estimate but 2.8% above the rate from a year earlier.
- The national average retail price for regular gasoline was $3.192 per gallon on February 12, $0.056 per gallon higher than the prior week’s price but $0.198 per gallon less than a year ago. Also, as of February 12, the East Coast price increased $0.034 to $3.151 per gallon; the Midwest price rose $0.133 to $3.044 per gallon; the Gulf Coast price decreased $0.014 to $2.807 per gallon; the Rocky Mountain price advanced $0.045 to $2.791 per gallon; and the West Coast price increased $0.028 to $4.011 per gallon.
- For the week ended February 10, there were 212,000 new claims for unemployment insurance, a decrease of 8,000 from the previous week’s level, which was revised up by 2,000. According to the Department of Labor, the advance rate for insured unemployment claims for the week ended February 3 was 1.3%, an increase of 0.1 percentage point from the previous week’s rate. The advance number of those receiving unemployment insurance benefits during the week ended February 3 was 1,895,000, an increase of 30,000 from the previous week’s level, which was revised down by 6,000. States and territories with the highest insured unemployment rates for the week ended January 27 were New Jersey (2.8%), Rhode Island (2.7%), Minnesota (2.5%), Massachusetts (2.4%), California (2.3%), Illinois (2.3%), Montana (2.2%), Alaska (2.1%), Connecticut (2.1%), Pennsylvania (2.1%), and Washington (2.1%). The largest increases in initial claims for unemployment insurance for the week ended February 3 were in Missouri (+1,921), Texas (+1,514), Colorado (+783), Illinois (+612), and Florida (+399), while the largest decreases were in Oregon (-4,561), California (-4,312), Ohio (-4,090), New York (-3,165), and Pennsylvania (-3,075).
Eye on the Week Ahead
There’s very little in terms of market-moving economic data being released this week. The Federal Open Market Committee releases the minutes from its last meeting, which might provide some insight as to the direction the Committee may be headed with respect to interest rates. Also out this week is the January data on sales of existing homes. Sales declined 1.0% in December and 6.2% year over year.
The Week Ahead

The information provided is obtained from sources believed to be reliable. Forecasts cannot be guaranteed. Past performance is not a guarantee of future results.
© 2021 Broadridge Financial Solutions, Inc. All Rights Reserved.