Wall Street fell from record highs to close generally lower last week. A better-than-expected jobs report (see below) helped support the notion that the economy remains strong and that the Federal Reserve will likely cut interest rates, possibly after their June meeting. However, the unemployment rate ticked up for the first time in four months. The tech-heavy Nasdaq led the decline in the benchmark indexes for the week, with only the Global Dow and the Russell 2000 closing higher. Crude oil prices posted a weekly loss as China’s demand waned. Gold prices rallied to their largest weekly increase in five months, driven higher by optimism of mid-year interest rate cuts.
Stocks closed last Monday in the red. After reaching record highs the prior week, both the Nasdaq (-0.4%) and the S&P 500 (-0.1%) fell. The Dow lost 0.3%, while the Russell 2000 slipped 0.1%. The Global Dow was flat. Ten-year Treasury yields inched up to 4.21%. Crude oil prices settled at about $78.72 per barrel after declining $1.25. The dollar ended the session where it began, while gold prices added 1.4%.
Wall Street saw equities extend their losses last Tuesday, driven by a widespread sell-off of tech shares. The Nasdaq fell 1.7% to lead the downturn, followed by the Russell 2000, Dow, and the S&P 500 (-1.0%). The Global Dow dipped 0.3%. The yield on 10-year Treasuries fell 8.2 basis points to 4.13%. Crude oil prices also continued to decline, falling to $78.14 per barrel. The dollar was flat, while gold prices rose 0.5%.
Last Wednesday saw stocks rebound after Fed Chair Jerome Powell maintained his stance that interest rates are likely to be cut sometime this year. The Russell 2000 and the Global Dow gained 0.7%, followed by the Nasdaq (0.6%), the S&P 500 (0.5%), and the Dow (0.2%). Ten-year Treasury yields slipped 3.3 basis points to close at 4.10%. Crude oil prices gained nearly $1.00 to settle at $79.13 per barrel. The dollar fell 0.4%, while gold prices rose 0.6%.
Stocks advanced for the second straight day last Thursday, with both the Nasdaq and the S&P 500 hitting new record highs. Tech shares fueled much of the rally, particularly AI stocks. By the close of trading, the Nasdaq rose 1.5%, the S&P 500 climbed 1.0%, the Russell 2000 gained 0.8%, the Global Dow advanced 0.7%, and the Dow increased 0.3%. Ten-year Treasury yields ticked lower to close at 4.09%. Crude oil prices closed at $78.89 per barrel. The dollar continued to slide, falling 0.5%. Gold prices advanced for the fourth straight day.
Last Friday’s volatile session saw stocks finish lower as a rally in chip stocks lost steam. Each of the benchmark indexes finished the session lower, with the Nasdaq falling the furthest (-2.3%), followed by the S&P 500 (-0.7%), the Dow (-0.2%), and the Russell 2000 (-0.1%). the Global Dow ended the session where it began. Ten-year Treasury yields were flat, while crude oil prices slipped 1.4%. The dollar lost less than 0.1%, while gold prices rose 0.9%.
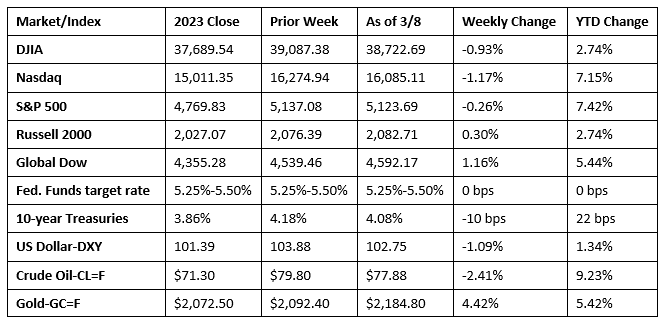
Chart reflects price changes, not total return. Because it does not include dividends or splits, it should not be used to benchmark performance of specific investments.
Last Week’s Economic News
- Employment rose by 275,000 in February. Job gains occurred in health care, in government, in food services and drinking places, in social assistance, and in transportation and warehousing. The change in employment for December was revised down by 43,000, and the change for January was revised down by 124,000. With these revisions, employment in December and January combined was 167,000 lower than previously reported. In February, the unemployment rate rose by 0.2 percentage point to 3.9%, and the number of unemployed people increased by 334,000 to 6.5 million. A year earlier, the jobless rate was 3.6%, and the number of unemployed people was 6.0 million. In February, the labor force participation rate was 62.5% for the third consecutive month, while the employment-population ratio decreased 0.1 percentage point to 60.1%. In February, average hourly earnings edged up by $0.05 to $34.57, following an increase of $0.18 in January. Average hourly earnings were up by 0.1% in February and 4.3% over the last 12 months. In February, the average workweek edged up by 0.1 hour to 34.3 hours, following a decline of 0.2 hour in January.
- According to the latest Job Openings and Labor Turnover Survey, the number of job openings in January, at 8.9 million, was little changed from the previous month. The total number of hires, at 5.7 million, fell by 100,000, while total separations, at 5.3 million, decreased by 78,000.
- Purchasing manager survey respondents noted a solid performance in February, according to the latest purchasing managers’ index from S&P Global. Output rose for the 13th consecutive month, while new business rose for the fourth straight month in February. Costs to service providers eased to the slowest pace since October 2020.
- The international trade in goods and services deficit in January was $67.4 billion, up $3.3 billion, or 5.1% from the December deficit. January exports were $257.2 billion, $0.3 billion, or 0.1% more than December exports. January imports were $324.6 billion, $3.6 billion, or 1.1% more than December imports. Since January 2023, the goods and services deficit decreased $2.9 billion, or 4.1%. Exports decreased $1.0 billion, or 0.4%, while imports fell $3.9 billion, or 1.2%.
- The national average retail price for regular gasoline was $3.350 per gallon on March 4, $0.101 per gallon more than the prior week’s price but $0.039 per gallon less than a year ago. Also, as of March 4, the East Coast price increased $0.036 to $3.240 per gallon; the Midwest price rose $0.171 to $3.269 per gallon; the Gulf Coast price climbed $0.104 to $2.949 per gallon; the Rocky Mountain price advanced $0.032 to $3.014 per gallon; and the West Coast price increased $0.147 to $4.229 per gallon.
- For the week ended March 2, there were 217,000 new claims for unemployment insurance, unchanged from the previous week’s level, which was revised up by 2,000. According to the Department of Labor, the advance rate for insured unemployment claims for the week ended February 24 was 1.3%, unchanged from the previous week’s rate. The advance number of those receiving unemployment insurance benefits during the week ended February 24 was 1,906,000, an increase of 8,000 from the previous week’s level, which was revised down by 7,000. States and territories with the highest insured unemployment rates for the week ended February 17 were New Jersey (2.8%), Rhode Island (2.7%), Minnesota (2.5%), California (2.4%), Massachusetts (2.4%), Illinois (2.2%), Montana (2.1%), Alaska (2.0%), New York (2.0%), and Pennsylvania (2.0%). The largest increases in initial claims for unemployment insurance for the week ended February 24 were in Massachusetts (+4,032), Rhode Island (+1,936), Connecticut (+429), California (+311), and Missouri (+310), while the largest decreases were in Oklahoma (-1,943), Texas (-1,121), Michigan (-980), Oregon (-823), and Florida (-752).
Eye on the Week Ahead
Inflation data for February is available this week with the Consumer Price Index, import and export prices, and the Producer Price Index. January saw prices increase across the board, although 12-month data showed prices either decreased or were unchanged.
The Week Ahead

The information provided is obtained from sources believed to be reliable. Forecasts cannot be guaranteed. Past performance is not a guarantee of future results.
© 2021 Broadridge Financial Solutions, Inc. All Rights Reserved.