The markets experienced a volatile week, ultimately closing mostly lower. Among the indexes listed here, only the Dow managed to eke out a weekly gain. The week ended with stocks posting gains, despite a tense meeting between President Trump and Ukrainian President Zelenskyy. Investors wrestled with the uncertain economic impact of President Trump’s proposed tariffs, inflationary pressures that refuse to subside, and geopolitical turmoil. Treasury yields declined as bond prices rose. Crude oil prices dipped lower. The dollar index rose, while gold prices declined.
Wall Street continued to lag last Monday following the prior week’s sharp losses. The NASDAQ lost 1.2%, the Russell 2000 fell 0.8%, and the S&P 500 dropped 0.5% as weakness in tech shares dragged stocks lower. The Global Dow slipped 0.1%, while the Dow eked out a 0.1% gain. Ten-year Treasury yields fell to 4.40%, the lowest level since mid-December. Crude oil prices edged up 0.6% to $70.83 per barrel. The dollar index was virtually unchanged, while gold prices rose 0.4%.
Stocks slid mostly lower last Tuesday as investors looked ahead to the latest earnings report from a major AI company. For the second straight day, tech shares tumbled, with the NASDAQ falling 1.4%. The S&P 500 extended its losing streak to four days after declining 0.5%. The Russell 2000 fell 0.4%. The Dow gained 0.4%, while the Global Dow was unchanged. Yields on 10-year Treasuries settled at 4.29% after sliding 9.5 basis points. Crude oil prices ended the day at $69.12 per barrel. The dollar dipped 0.1%, while gold prices rose 0.6%.
The market returns were mixed last Wednesday. The S&P 500 barely ended its losing streak. The NASDAQ gained 0.3%, while the Global Dow and the Russell 2000 added 0.2%. The Dow fell 0.4%. Technology, which had been lagging, drove market gains. Ten-year Treasury yields fell to 4.24%. Crude oil prices dropped to $68.77 per barrel. The dollar index gained 0.2%, while gold prices rose 0.4%.
Stocks slid sharply last Thursday, dragged lower by a selloff in tech shares. The NASDAQ fell 2.8%, the S&P 500 dropped 1.6%, the Russell 2000 lost 1.3%, the Global Dow declined 0.8%, and the Dow slid 0.5%. While the earnings report from a major AI company beat analysts’ expectations, potential tariffs on chips worried investors. Ten-year Treasury yields ticked up to 4.28%. Crude oil prices rose to $70.16 per barrel. The dollar index gained 0.8%, while gold prices fell 1.6%.
The stock market ended last week on a high note, with each of the benchmark indexes listed here posting gains. The NASDAQ and the S&P 500 each advanced 1.6%. The Dow gained 1.4%. The Russell 2000 added 1.0%, and the Global Dow ticked up 0.1%. Ten-year Treasury yields ended the session down 5.2 basis points. Crude oil prices fell about 0.4%. The dollar index gained 0.3%, while gold prices fell 1.1%.
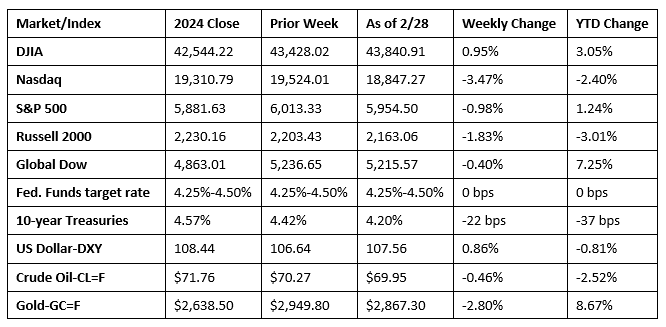
Chart reflects price changes, not total return. Because it does not include dividends or splits, it should not be used to benchmark performance of specific investments.
Last Week’s Economic News
- According to the second estimate from the Bureau of Economic Analysis, gross domestic product rose 2.3% in the fourth quarter of 2024. GDP increased 3.1% in the third quarter. Compared to the third quarter, the deceleration in GDP in the fourth quarter primarily reflected downturns in investment and exports that were partly offset by an acceleration in consumer spending. Imports, which are a negative in the calculation of GDP, turned down. The personal consumption expenditures (PCE) price index rose 2.4% in the fourth quarter, 0.1 percentage point above the increase in the third quarter. For 2024, the PCE price index increased 2.5%. Personal consumption expenditures rose 4.2% in the fourth quarter after advancing 3.7% in the third quarter.
- Both personal income and disposable (after-tax) personal income advanced 0.9% in January, according to the latest data from the Bureau of Economic Analysis. Personal consumption expenditures (PCE), a measure of consumer spending, fell 0.2% in January. The PCE price index for January increased 0.3%. Excluding food and energy, the PCE price index increased 0.3%. From the same month one year ago, the PCE price index for January increased 2.5%, while the PCE price index excluding food and energy increased 2.6%.
- The international trade in goods deficit was $153.3 billion in January, up $31.2 billion, or 25.6%, from December. Exports of goods for January were $172.2 billion, $3.3 billion, or 2.0%, more than December exports. Imports of goods for January were $325.4 billion, $34.6 billion, or 11.9%, more than December imports.
- New orders for manufactured durable goods increased 3.1% in January after decreasing in each of the previous two months. Excluding transportation, new orders were virtually unchanged. Excluding defense, new orders increased 3.5%. Transportation equipment, also up following two consecutive monthly decreases, led the increase, climbing 9.8%.
- Sales of new single-family homes in January were 10.5% below the prior month’s total and 1.1% below the January 2024 estimate. The median sales price of new houses sold in January 2025 was $446,300. The average sales price was $510,000. The inventory of new houses for sale in January represented a supply of 9.0 months at the current sales pace.
- The national average retail price for regular gasoline was $3.125 per gallon on February 24, $0.023 per gallon below the prior week’s price and $0.124 per gallon less than a year ago. Also, as of February 24, the East Coast price fell $0.013 to $3.011 per gallon; the Midwest price decreased $0.044 to $2.938 per gallon; the Gulf Coast price declined $0.036 to $2.704 per gallon; the Rocky Mountain price decreased $0.027 to $3.019 per gallon; and the West Coast price increased $0.001 to $4.188 per gallon.
- For the week ended February 22, there were 242,000 new claims for unemployment insurance, an increase of 22,000 from the previous week’s level, which was revised up by 1,000. According to the Department of Labor, the advance rate for insured unemployment claims for the week ended February 15 was 1.2%. The advance number of those receiving unemployment insurance benefits during the week ended February 15 was 1,862,000, a decrease of 5,000 from the previous week’s level, which was revised down by 2,000. States and territories with the highest insured unemployment rates for the week ended February 8 were New Jersey (2.9%), Rhode Island (2.9%), Minnesota (2.5%), Washington (2.5%), California (2.4%), Illinois (2.4%), Massachusetts (2.4%), Montana (2.4%), Pennsylvania (2.0%), Connecticut (1.9%), Michigan (1.9%), and New York (1.9%). The largest increases in initial claims for unemployment insurance for the week ended February 15 were in Kentucky (+3,012), Tennessee (+2,766), Washington (+735), Michigan (+452), and Minnesota (+83), while the largest decreases were in California (-5,530), Pennsylvania (-1,110), Florida (-981), New Jersey (-903), and New York (-698).
Eye on the Week Ahead
The jobs data for February is available this week. January saw employment increase by 143,000, while average hourly earnings ticked up 0.5% for the month and 4.1% over the last 12 months.
The Week Ahead

The information provided is obtained from sources believed to be reliable. Forecasts cannot be guaranteed. Past performance is not a guarantee of future results.
© 2021 Broadridge Financial Solutions, Inc. All Rights Reserved.