The last week of the month proved to be a tough one for Wall Street. Each of the benchmark indexes listed here closed the week lower, impacted by stubborn inflation and a cooling of major tech and AI stocks. The Producer Price Index rose faster than in the previous two months (see below), which fueled fears that the Federal Reserve will keep interest rates at their current level for longer than investors hoped. Geopolitical risks provided a backdrop of uncertainty. U.S.-Iran tensions escalated, which directly impacted crude oil prices. Financials and information technology were laggards among the market sectors, while defensive sectors, such as consumer staples, utilities, and health care, outperformed.
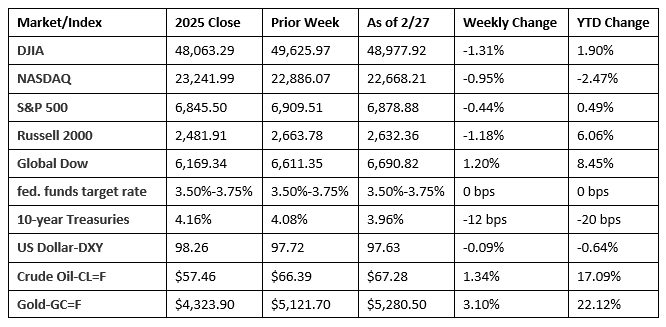
Chart reflects price changes, not total return. Because it does not include dividends or splits, it should not be used to benchmark performance of specific investments.
Last Week’s Economic News
- The Producer Price Index increased 0.5% in January after advancing 0.4% in December 2025 and 0.2% in November. Producer prices rose 2.9% for the 12 months ended January 2026. The January increase in prices can be traced to a 0.8% increase in the prices for services. In contrast, prices for goods declined 0.3%. Producer prices less foods, energy, and trade services moved up 0.3% in January, the ninth consecutive monthly increase. For the 12 months ended in January, prices less foods, energy, and trade services rose 3.4%.
- For the week ended February 21, there were 212,000 new claims for unemployment insurance, an increase of 4,000 from the previous week’s level, which was revised up by 2,000. According to the Department of Labor, the advance rate for insured unemployment claims for the week ended February 14 was 1.2%, unchanged from the previous week’s rate. The advance number of those receiving unemployment insurance benefits during the week ended February 14 was 1,833,000, a decrease of 31,000 from the previous week’s level, which was revised down by 5,000. States and territories with the highest insured unemployment rates for the week ended February 7 were Rhode Island (3.0%), New Jersey (2.9%), Massachusetts (2.7%), Minnesota (2.5%), Washington (2.5%), Illinois (2.3%), California (2.2%), New York (2.2%), Montana (2.1%), Michigan (2.0%), Oregon (2.0%), and Pennsylvania (2.0%). The largest increases in initial claims for unemployment insurance for the week ended February 14 were in Iowa (+377), Michigan (+105), Florida (+84), and Nevada (+1), while the largest decreases were in New York (-7,615), Pennsylvania (-5,201), New Jersey (-2,845), California (-2,386), and Texas (-2,368).
- The national average retail price for regular gasoline was $2.937 per gallon on February 23, $0.013 per gallon above the prior week’s price but $0.188 per gallon less than a year ago. Also, as of February 23, the East Coast price increased $0.001 to $2.834 per gallon; the Midwest price decreased $0.008 to $2.675 per gallon; the Gulf Coast price rose $0.050 to $2.532 per gallon; the Rocky Mountain price fell $0.075 to $2.662 per gallon; and the West Coast price increased $0.066 to $4.111 per gallon.
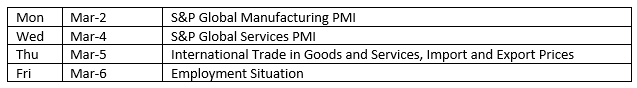
Eye on the Week Ahead
The labor figures for February are out this week. New jobs grew by 130,000 in January. Also out this week are the February purchasing managers’ surveys for both manufacturing and services.
The Week Ahead
The information provided is obtained from sources believed to be reliable. Forecasts cannot be guaranteed. Past performance is not a guarantee of future results.
Data sources: Economic: Based on data from U.S. Bureau of Labor Statistics (unemployment, inflation); U.S. Department of Commerce (GDP, corporate profits, retail sales, housing); S&P/Case-Shiller 20-City Composite Index (home prices); Institute for Supply Management (manufacturing/services). Performance: Based on data reported in WSJ Market Data Center (indexes); U.S. Treasury (Treasury yields); U.S. Energy Information Administration/Bloomberg.com Market Data (oil spot price, WTI, Cushing, OK); www.goldprice.org (spot gold/silver); Oanda/FX Street (currency exchange rates).
© 2026 Broadridge Financial Solutions, Inc. All Rights Reserved.