The U.S. stock market enjoyed a second straight rally last week as geopolitical tensions shifted, at least temporarily, from escalation to diplomacy. After a period of high volatility and risk aversion, investors were encouraged by the announcement of a ceasefire between the United States and Iran. Each of the benchmark indexes listed here closed the week with gains, while 10 of the 11 market sectors climbed, with the exception of energy. Information technology, communication services, and consumer discretionary outperformed. Crude oil prices, which touched $112 per barrel earlier in the week, fell sharply following the aforementioned ceasefire. Economic data released last week was mixed. The third estimate of gross domestic product was revised down 0.2 percentage point from the second estimate (see below). The monthly government deficit widened and inflationary pressures remained sticky, although consumer spending ticked up. Treasury yields ended the week about where they started, with the yield on 10-year Treasuries rising at the end of last week.
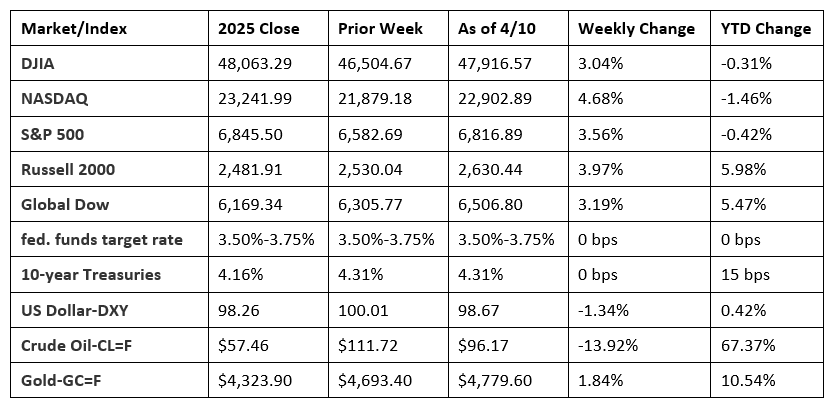
Chart reflects price changes, not total return. Because it does not include dividends or splits, it should not be used to benchmark performance of specific investments.
Last Week’s Economic News
- The third and final estimate of gross domestic product for the fourth quarter of 2025 revealed that the economy expanded at an annualized rate of 0.5%. In the third quarter of 2025, GDP increased 4.4%. Compared to the third quarter, personal consumption expenditures (PCE), a measure of consumer spending and the largest contributor to GDP, fell from 3.5% to 1.9%. Spending decreased for both goods and services. Gross domestic investment increased from no change in the third quarter to an increase of 2.3% in the fourth quarter. Nonresidential (business) investment rose 2.4% in the fourth quarter, outpacing residential investment, which fell 1.7%. Exports declined from 9.6% in the third quarter to -3.2% in the fourth quarter. Imports fell 1.0% in the fourth quarter after falling 4.4% in the previous quarter. Government spending declined 5.6% in the fourth quarter after rising 2.2% in the third quarter.
- According to the latest report from the Bureau of Economic Analysis, originally scheduled for release on March 27, both personal income and disposable (after-tax) personal income fell 0.1% in February. Personal consumption expenditures increased 0.5% in February. From January, the personal consumption expenditures price index increased 0.4% in February. Excluding food and energy, the PCE price index also increased 0.4%. For the 12 months ended in February, the PCE price index increased 2.8%, while prices less food and energy rose 3.0%.
- The Consumer Price Index for March jumped 0.9% following a 0.3% increase in February. Prices less food and energy rose 0.2% last month, the same increase as in February. For the 12 months ended in March, consumer prices rose 3.3%, well above the 2.4% advance for the 12 months ended in February. Prices less food and energy rose 2.6% since March 2025. Energy prices, which rose 10.9% in March (including a 21.2% increase in gasoline prices), accounted for much of the monthly increase in overall prices. Shelter prices increased 0.3% in March, while prices for food were unchanged over the month. Prices for energy increased 12.5% for the 12 months ended March. Food prices increased 2.7% over the last year.
- New orders for manufactured durable goods decreased 1.4% in February, according to the latest data released by the Census Bureau. This followed a 0.5% January decrease. Excluding transportation, new orders increased 0.8%. Excluding defense, new orders decreased 1.2%. Transportation equipment, down four of the last five months, drove the overall decrease, falling 5.4% in February.
- The Federal budget saw a deficit of $164 billion in March. Receipts totaled $385 billion, while outlays were $549 billion. Through the first six months of the fiscal year, the deficit sits at $1,169 billion. The deficit was $1,307 billion over the comparable period last fiscal year. So far in this fiscal year, receipts totaled $2,483 billion, while outlays were $3,651 billion.
- For the week ended April 4, there were 219,000 new claims for unemployment insurance, an increase of 16,000 from the previous week’s level, which was revised up by 1,000. According to the Department of Labor, the advance rate for insured unemployment claims for the week ended March 28 was 1.2%, unchanged from the previous week’s rate. The advance number of those receiving unemployment insurance benefits during the week ended March 28 was 1,794,000, a decrease of 38,000 from the previous week’s level, which was revised down by 9,000. This is the lowest level for insured unemployment since May 11, 2024, when it was 1,791,000. States and territories with the highest insured unemployment rates for the week ended March 21 were Rhode Island (2.7%), Massachusetts (2.6%), New Jersey (2.6%), Minnesota (2.3%), Washington (2.3%), California (2.1%), Illinois (2.0%), New York (2.0%), Michigan (1.9%), Oregon (1.9%), Montana (1.8%), and Puerto Rico (1.8%). The largest increases in initial claims for unemployment insurance for the week ended March 28 were in Texas (+1,952), New York (+1,236), Oregon (+1,091), Wisconsin (+804), and Illinois (+721), while the largest decreases were in Michigan (-2,751), Georgia (-1,059), Iowa (-1,057), Pennsylvania (-598), and Massachusetts (-459).
- The national average retail price for regular gasoline was $4.120 per gallon on April 6, $0.130 per gallon above the prior week’s price and $0.877 per gallon higher than a year ago. Also, as of April 6, the East Coast price increased $0.186 to $4.000 per gallon; the Midwest price rose $0.062 to $3.771 per gallon; the Gulf Coast price increased $0.197 to $3.787 per gallon; the Rocky Mountain price fell $0.024 to $3.893 per gallon; and the West Coast price increased $0.062 to $5.396 per gallon.
Eye on the Week Ahead
This week brings with it the release of multiple reports across several economic sectors. The report on existing home sales for March is available this week. February saw sales increase by 1.7%. The latest data on producer prices is also out this week. For the 12 months ended in February, producer prices have risen 3.4%. The March report on import and export prices follows February data, which showed an increase in both import and export prices. Finally, the Federal Reserve’s report on industrial production for March closes the week. Industrial production ticked up 0.2% in February.
The Week Ahead

The information provided is obtained from sources believed to be reliable. Forecasts cannot be guaranteed. Past performance is not a guarantee of future results.
Data sources: Economic: Based on data from U.S. Bureau of Labor Statistics (unemployment, inflation); U.S. Department of Commerce (GDP, corporate profits, retail sales, housing); S&P/Case-Shiller 20-City Composite Index (home prices); Institute for Supply Management (manufacturing/services). Performance: Based on data reported in WSJ Market Data Center (indexes); U.S. Treasury (Treasury yields); U.S. Energy Information Administration/Bloomberg.com Market Data (oil spot price, WTI, Cushing, OK); www.goldprice.org (spot gold/silver); Oanda/FX Street (currency exchange rates).
© 2026 Broadridge Financial Solutions, Inc. All Rights Reserved.