Wall Street saw stocks continue to trend lower last week, influenced by geopolitical tension, volatile energy markets, and shifting investor sentiment. The Dow, the S&P 500, and the NASDAQ each closed the week lower, while the small caps of the Russell 2000 and the Global Dow settled marginally higher. Investors reacted to developments surrounding the U.S.-Iran negotiations and the temporary halt in U.S. strikes on Iranian energy infrastructure. The S&P 500 marked its fifth straight weekly decline, its longest such streak since early 2022. With last week’s losses, the NASDAQ slid deeper into correction territory. Energy and materials outperformed, while communication services and information technology notably lagged. Oil prices swung sharply, while economic data showed resilience but rising uncertainty.
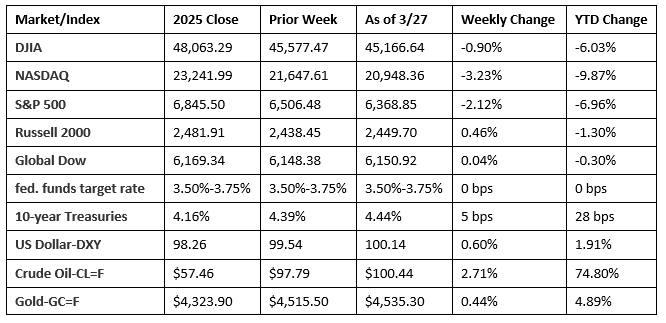
Chart reflects price changes, not total return. Because it does not include dividends or splits, it should not be used to benchmark performance of specific investments.
Last Week’s Economic News
- Import prices increased 1.3% in February following a 0.6% advance in January. The February advance was the largest monthly increase since March 2022 when prices rose 2.9%. Import prices increased 1.3% for the 12 months ended February 2026. This was the largest annual increase since prices rose 1.7% for the 12 months ended February 2025. The increase last month was driven by increases in prices for fuels and lubricants (3.8%) and nonfuel imports (1.1%). Prices for U.S. exports advanced 1.5% in February after rising 0.6% the previous month. The February increase in export prices was the largest monthly advance since prices climbed 2.7% in May 2022. Higher prices for nonagricultural exports and agricultural exports drove the advance in February. Prices for exports also increased 3.5% over the 12-month period ended in February 2026.
- For the week ended March 21, there were 210,000 new claims for unemployment insurance, an increase of 5,000 from the previous week’s level. According to the Department of Labor, the advance rate for insured unemployment claims for the week ended March 14 was 1.2%, unchanged from the previous week’s rate. The advance number of those receiving unemployment insurance benefits during the week ended March 14 was 1,819,000, a decrease of 32,000 from the previous week’s level, which was revised down by 6,000. This is the lowest level for insured unemployment since May 25, 2024, when it was 1,804,000. States and territories with the highest insured unemployment rates for the week ended March 7 were Rhode Island (3.0%), New Jersey (2.8%), Massachusetts (2.7%), Washington (2.4%), Minnesota (2.3%), California (2.2%), Illinois (2.1%), New York (2.1%), Michigan (2.0%), Montana (2.0%), Connecticut (1.9%), and Oregon (1.9%). The largest increases in initial claims for unemployment insurance for the week ended March 14 were in Kentucky (+3,305), Oklahoma (+1,201), Tennessee (+553), Nebraska (+357), and Ohio (+271), while the largest decreases were in California (-4,397), Missouri (-3,217), New York (-2,909), New Jersey (-1,745), and Pennsylvania (-1,639).
- The national average retail price for regular gasoline was $3.961 per gallon on March 23, $0.241 per gallon above the prior week’s price and $0.846 per gallon higher than a year ago. Also, as of March 23, the East Coast price increased $0.208 to $3.785 per gallon; the Midwest price rose $0.291 to $3.684 per gallon; the Gulf Coast price increased $0.192 to $3.604 per gallon; the Rocky Mountain price climbed $0.213 to $3.850 per gallon; and the West Coast price increased $0.275 to $5.262 per gallon.
Eye on the Week Ahead
The labor figures for March are released this week. Employment gains have been somewhat stagnant for the past several months, and most analysts predict March will show minimal job gains.
The Week Ahead

The information provided is obtained from sources believed to be reliable. Forecasts cannot be guaranteed. Past performance is not a guarantee of future results.
Data sources: Economic: Based on data from U.S. Bureau of Labor Statistics (unemployment, inflation); U.S. Department of Commerce (GDP, corporate profits, retail sales, housing); S&P/Case-Shiller 20-City Composite Index (home prices); Institute for Supply Management (manufacturing/services). Performance: Based on data reported in WSJ Market Data Center (indexes); U.S. Treasury (Treasury yields); U.S. Energy Information Administration/Bloomberg.com Market Data (oil spot price, WTI, Cushing, OK); www.goldprice.org (spot gold/silver); Oanda/FX Street (currency exchange rates).
© 2026 Broadridge Financial Solutions, Inc. All Rights Reserved.