The stock market closed generally higher last week, despite a minor setback last Friday. Market momentum was driven by cooling inflation data (see below), solid Q2 corporate earnings reports, and strengthening opinions that the Federal Reserve may posture a more dovish approach to interest rates in the near term. The S&P 500 reached an all-time record high last Thursday, climbing to 7,816. Nine of the 11 market sectors posted gains, with the exception of consumer discretionary and communication services, which closed lower. Treasury yields eased somewhat on the greater likelihood that the Fed would not hike rates any time soon. Crude oil prices rose above $82 per barrel as the U.S. increased economic pressure on Iran to reopen the Strait of Hormuz.
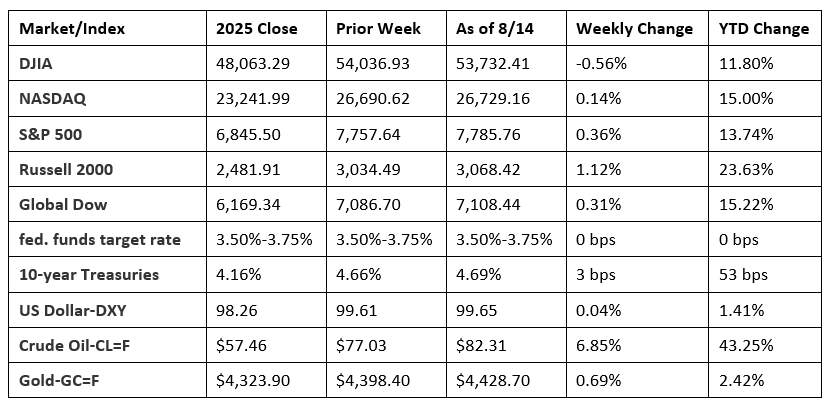
Chart reflects price changes, not total return. Because it does not include dividends or splits, it should not be used to benchmark performance of specific investments.
Last Week’s Economic News
- The Consumer Price Index (CPI) increased 0.1% in July after falling 0.4% in June, according to the Bureau of Labor Statistics. Prices for shelter rose 0.1% in July, accounting for roughly two-thirds of the overall monthly increase. Prices for food also increased 0.1% last month, as prices for food away from home rose 0.3%. In contrast, energy prices declined 1.5% in July. Prices less food and energy rose 0.2% in July after being unchanged in June. Last month, prices increased for medical care, airline fares, communication, education, and recreation. Conversely, prices fell for medical care commodities, health insurance, and motor vehicle insurance. The CPI rose 3.4% for the 12 months ended in July after rising 3.5% for the 12 months ended in June. Prices less food and energy rose 2.5% over the last 12 months following a 2.6% increase over the 12 months ended in June. Energy prices increased 14.7% since July 2025. Food prices increased 3.0% over the same 12-month period.
- The Producer Price Index (PPI) was unchanged in July from the previous month. A 0.2% increase in prices for services offset a 0.7% decrease in prices for goods. The PPI less foods, energy, and trade services rose 0.4% in July after ticking up 0.1% in June. Producer prices less foods and energy inched up 0.1% last month. Since July 2025, producer prices rose 4.7%, the same 12-month increase as prices less foods, energy, and trade services. Of particular note, a major factor in the July decrease in goods prices was a 3.1% decline in prices for energy. Prices for foods moved down 0.9%.
- Retail sales fell 0.6% in July from the prior month, sharply missing expectations and reversing the 0.2% June gain. The decline in retail sales was the first since October 2025 and the largest decline in over a year. Contributing to the July decrease were declines in sales for motor vehicle and parts dealers, electronics and appliance stores, gasoline stations, and online retailers. Despite the July swoon, retail sales were up 5.0% from July 2025.
- Sales of existing homes declined 1.7% in July but were up 0.7% from a year earlier. According to the latest report from the National Association of REALTORS®, at an estimated supply of 4.6 months, unsold inventory in July was unchanged from the previous month and from July 2025. The median existing home sales price in July was $434,100, 2.0% below the June estimate but 2.0% above the July 2025 price of $425,700. Sales of existing single-family homes fell 1.9% last month but were up 0.8% from July 2025. The median existing single-family home price in July was $440,300, 1.9% below the June price but 1.9% above the price from a year earlier.
- The government ran a deficit of $432 billion in July. Government receipts totaled $334 billion and outlays were $766 billion. According to the report from the Department of the Treasury, July has been a deficit month 70 times out of 72 fiscal years, since there are usually no major corporate or individual tax due dates in this month. Also, outlays for military active duty and retirement, veterans benefits, Supplemental Security Income, and Medicare payments to health maintenance organizations and prescription drug plans accelerated into July, because August 1, 2026, the normal payment date, fell on a non-business day. Through the first 10 months of the fiscal year, the deficit sat at $1,799 billion, 10.5% above the deficit over the same period in the previous fiscal year.
- For the week ended August 8, there were 209,000 new claims for unemployment insurance, an increase of 9,000 from the previous week’s level, which was revised up by 1,000. According to the Department of Labor, the advance rate for insured unemployment claims for the week ended August 1 was 1.2%, unchanged from the prior week’s rate. The advance number of those receiving unemployment insurance benefits during the week ended August 1 was 1,777,000, a decrease of 22,000 from the previous week’s level, which was revised down by 2,000. States and territories with the highest insured unemployment rates for the week ended July 25 were New Jersey (2.6%), Puerto Rico (2.6%), Rhode Island (2.3%), Massachusetts (2.1%), Minnesota (2.1%), Oregon (2.0%), California (1.9%), Washington (1.9%), Connecticut (1.8%), Nevada (1.7%), New York (1.7%), and Pennsylvania (1.7%). The largest increases in initial claims for unemployment insurance for the week ended August 1 were in New Jersey (+690), Pennsylvania (+688), Connecticut (+352), South Carolina (+220), and Iowa (+175), while the largest decreases were in California (-973), Illinois (-761), North Carolina (-677), Ohio (-636), and Georgia (-506).
- The national average retail price for regular gasoline was $4.006 per gallon on August 10, $0.073 per gallon below the prior week’s price but $0.888 per gallon higher than a year ago. Also, as of August 10, the East Coast price decreased $0.060 to $3.884 per gallon; the Midwest price fell $0.113 to $3.816 per gallon; the Gulf Coast price dropped $0.061 to $3.543 per gallon; the Rocky Mountain price decreased $0.018 to $4.121 per gallon; and the West Coast price declined $0.055 to $5.075 per gallon.
Eye on the Week Ahead
This week is light on market-moving economic reports. However, investors may pay particular attention to the July data on import and export prices (a measure of inflation) and the latest report on industrial production.
The Week Ahead

The information provided is obtained from sources believed to be reliable. Forecasts cannot be guaranteed. Past performance is not a guarantee of future results.
Data sources: Economic: Based on data from U.S. Bureau of Labor Statistics (unemployment, inflation); U.S. Department of Commerce (GDP, corporate profits, retail sales, housing); S&P/Case-Shiller 20-City Composite Index (home prices); Institute for Supply Management (manufacturing/services). Performance: Based on data reported in WSJ Market Data Center (indexes); U.S. Treasury (Treasury yields); U.S. Energy Information Administration/Bloomberg.com Market Data (oil spot price, WTI, Cushing, OK); www.goldprice.org (spot gold/silver); Oanda/FX Street (currency exchange rates).
© 2026 Broadridge Financial Solutions, Inc. All Rights Reserved.