A strong finish on Friday helped U.S. equities close last week on a positive note. Despite the end-of-week rally, stocks experienced significant volatility as investors swayed between optimism over potentially strong corporate earnings versus concerns over elevated Treasury yields and sticky inflation. Nevertheless, benchmark indexes posted notable gains, with the NASDAQ notching its fourth consecutive weekly gain, while the S&P 500 ended a seven-week losing streak. Last week’s performance suggested that the rally extended beyond tech and AI stocks, which had carried the market for the past few weeks. This development was further evidenced by the performance of the market indexes, where gains were noted in all sectors except information technology and industrials. Treasury yields were also volatile last week, reaching their highest levels since 2002, only to fall at the end of the week. Crude oil prices dipped marginally last Friday after President Trump pledged not to attack Iran until after the midterm elections.
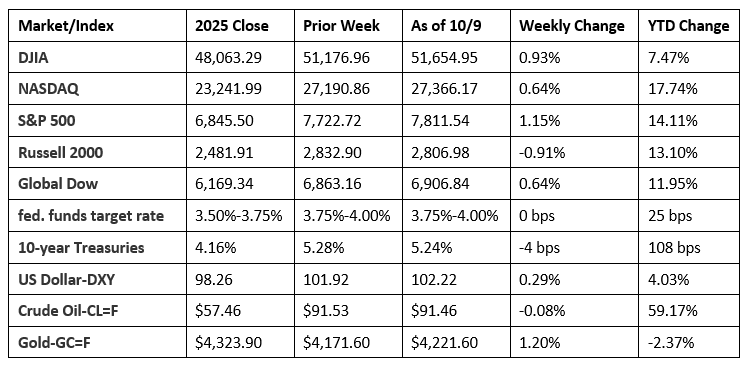
Chart reflects price changes, not total return. Because it does not include dividends or splits, it should not be used to benchmark performance of specific investments.
Last Week’s Economic News
- Business activity in the service sector surged higher in September, rising at the fastest pace in over five years on the strength of a further sharp increase in new orders. Rising demand and improved optimism encouraged firms to take on workers at a rate not seen for over four years. However, the strong growth in the services sector was accompanied by substantial price pressures, with the pace of business cost inflation quickening to the fastest since November 2022.
- The goods and services trade deficit was $105.6 billion in August, up $12.7 billion, or 13.7%, from $92.8 billion in July, revised. August exports were $315.2 billion, $4.5 billion, or 1.4%, more than July exports. August imports were $420.8 billion, $17.2 billion, or 4.3%, more than July imports. Year to date, the goods and services deficit decreased $138.2 billion, or 19.9%, from the same period in 2025. Exports increased $267.7 billion, or 11.8%. Imports increased $129.5 billion, or 4.4%.
- For the week ended October 3, there were 197,000 new claims for unemployment insurance, a decrease of 2,000 from the previous week’s level, which was revised up by 2,000. According to the Department of Labor, the advance rate for insured unemployment claims for the week ended September 26 was 1.1%, unchanged from the prior week’s rate. The advance number of those receiving unemployment insurance benefits during the week ended September 26 was 1,716,000, an increase of 17,000 from the previous week’s level, which was revised down by 2,000. States and territories with the highest insured unemployment rates for the week ended September 19 were New Jersey (2.0%), Washington (1.8%), California (1.7%), Massachusetts (1.7%), Puerto Rico (1.7%), Nevada (1.6%), Oregon (1.5%), Rhode Island (1.5%), New York (1.4%), Illinois (1.3%), and the Virgin Islands (1.3%). The largest increases in initial claims for unemployment insurance for the week ended September 26 were in Michigan (+739), Nevada (+167), Maryland (+105), North Dakota (+26), and Arizona (+19), while the largest decreases were in Hawaii (-1,172), New York (-819), Illinois (-625), Georgia (-543), and Texas (-506).
- The national average retail price for regular gasoline was $4.354 per gallon on October 5, $0.111 per gallon below the prior week’s price but $1.230 per gallon higher than a year ago. Also, as of October 5, the East Coast price decreased $0.143 to $4.147 per gallon; the Midwest price fell $0.182 to $4.109 per gallon; the Gulf Coast price decreased $0.013 to $3.911 per gallon; the Rocky Mountain price declined $0.069 to $4.417 per gallon; and the West Coast price ticked up $0.003 to $5.727 per gallon.
Eye on the Week Ahead
The latest inflation data is available this week. The Consumer Price Index for September is available mid-week. August saw prices increase 0.4% for the month and 3.4% over the last 12 months.
The Week Ahead

The information provided is obtained from sources believed to be reliable. Forecasts cannot be guaranteed. Past performance is not a guarantee of future results.
Data sources: Economic: Based on data from U.S. Bureau of Labor Statistics (unemployment, inflation); U.S. Department of Commerce (GDP, corporate profits, retail sales, housing); S&P/Case-Shiller 20-City Composite Index (home prices); Institute for Supply Management (manufacturing/services). Performance: Based on data reported in WSJ Market Data Center (indexes); U.S. Treasury (Treasury yields); U.S. Energy Information Administration/Bloomberg.com Market Data (oil spot price, WTI, Cushing, OK); www.goldprice.org (spot gold/silver); Oanda/FX Street (currency exchange rates).
© 2026 Broadridge Financial Solutions, Inc. All Rights Reserved.