Wall Street experienced a week marked by volatility, with big tech and AI stocks faltering after carrying the market for much of the year. Concerns about overvaluations drove investors from semiconductor and AI shares. The latest inflationary data showed prices moving higher, particularly energy and gasoline. Consumer staples, health care, and energy led the market sectors, while information technology fell 6.60%. Treasury yields declined, mostly in response to a brief rally in equities last Thursday. Geopolitical tensions continued to push energy prices higher.
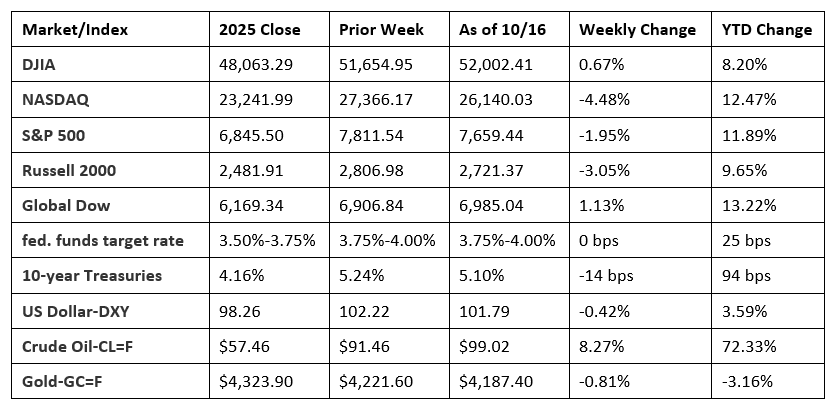
Chart reflects price changes, not total return. Because it does not include dividends or splits, it should not be used to benchmark performance of specific investments.
Last Week’s Economic News
- The Consumer Price Index (CPI) rose 0.6% in September and 3.7% over the last 12 months. The CPI rose 0.4% in August and 3.4% since August 2025. Core prices, excluding food and energy, rose 0.3% last month, matching the August increase. Since September 2025, core prices have risen 2.6%. Energy costs rose 5.2% in September, driven by a 9.1% spike in gasoline prices. Energy prices are up 20.4% since September 2025. Shelter costs followed a 0.3% increase in August with a 0.4% advance in September. Food prices were unchanged in September from the prior month.
- The Producer Price Index (PPI) increased 1.3% in September, after moving up 0.5% in August and 0.2% in July. The September increase was the largest advance since rising 1.7% in March 2022. The PPI climbed 6.3% for the 12 months ended in September, the largest 12-month increase since December 2022 when the index rose 6.4%. Prices for goods advanced 2.6% in September, the largest increase since data was first calculated in December 2009. Over 80% of the broad-based rise in September was attributable to prices for energy, which jumped 10.8%. Gasoline prices rose 20.3% last month, while prices for food rose 1.2%. Prices for services moved up 0.8% in September, the largest monthly rise since April when prices also advanced 0.8%.
- U.S. retail and food services sales increased 0.8% in September from the previous month and 6.3% from September 2025. The largest contributor to the increase in retail sales was a 6.4% advance in sales from gasoline stations. Total retail sales, excluding gasoline stations sales, rose 0.2% last month.
- Sales of existing homes increased 1.5% in September but were 2.2% below the pace from a year earlier. In September, unsold inventory represented a supply of 4.8 months at the current sales pace, unchanged from the August estimate but up from 4.5 months a year ago. The median sales price in September was $417,500, down from $427,700 in August but higher than the September 2025 price of $412,300. Sales of existing single-family homes rose 2.0% in September but were down 1.9% from a year earlier. The median existing single-family home price in September was $422,700, well below the August price of $433,600 but higher than the September 2025 price of $417,600.
- Import prices increased 1.1% in September following a 0.5% rise in August. Prices for imports rose 8.1% for the 12 months ended September 2026, the largest 12-month advance since import prices increased 8.8% for the year ended July 2022. Import prices for fuel increased 4.8% in September following decreases of 0.2% in August and 6.8% in July. Import prices excluding fuel increased 0.7% in September and have not declined on a monthly basis since August 2025. Prices for exports increased 2.2% in September after rising 1.2% the previous month. Export prices increased 11.6% for the year ended September 2026, the largest over-the-year rise since export prices advanced 12.9% for the 12 months ended July 2022.
- Industrial production (IP) increased 0.7% in September after edging up 0.1% in August. Manufacturing output rose 0.3% in September. Mining moved up 0.2%, and utilities increased 3.5%. Total IP in September was 2.2% above its year-earlier level.
- For the week ended October 10, there were 199,000 new claims for unemployment insurance, an increase of 1,000 from the previous week’s level, which was revised up by 1,000. According to the Department of Labor, the advance rate for insured unemployment claims for the week ended October 3 was 1.1%, unchanged from the prior week’s rate. The advance number of those receiving unemployment insurance benefits during the week ended October 3 was 1,710,000, a decrease of 4,000 from the previous week’s level, which was revised down by 2,000. States and territories with the highest insured unemployment rates for the week ended September 26 were New Jersey (2.0%), Massachusetts (1.8%), Washington (1.8%), California (1.7%), Nevada (1.6%), Puerto Rico (1.6%), Oregon (1.5%), Rhode Island (1.5%), New York (1.4%), Hawaii (1.3%), Illinois (1.3%), and the Virgin Islands (1.3%). The largest increases in initial claims for unemployment insurance for the week ended October 3 were in California (+4,295), Illinois (+1,108), New Jersey (+856), New York (+743), and Texas (+670), while the largest decreases were in Hawaii (-275), Michigan (-146), Iowa (-96), Arizona (-44), and West Virginia (-31).
- The national average retail price for regular gasoline was $4.331 per gallon on October 12, $0.023 per gallon below the prior week’s price but $1.270 per gallon higher than a year ago. Also, as of October 12, the East Coast price decreased $0.029 to $4.118 per gallon; the Midwest price rose $0.036 to $4.145 per gallon; the Gulf Coast price decreased $0.060 to $3.851 per gallon; the Rocky Mountain price increased $0.022 to $4.439 per gallon; and the West Coast price ticked down $0.088 to $5.639 per gallon.
Eye on the Week Ahead
This is a very slow week relative to the release of important economic data. However, investors will be looking forward to the last week of October, with particular attention paid to the meeting of the Federal Open Market Committee.
The Week Ahead

The information provided is obtained from sources believed to be reliable. Forecasts cannot be guaranteed. Past performance is not a guarantee of future results.
Data sources: Economic: Based on data from U.S. Bureau of Labor Statistics (unemployment, inflation); U.S. Department of Commerce (GDP, corporate profits, retail sales, housing); S&P/Case-Shiller 20-City Composite Index (home prices); Institute for Supply Management (manufacturing/services). Performance: Based on data reported in WSJ Market Data Center (indexes); U.S. Treasury (Treasury yields); U.S. Energy Information Administration/Bloomberg.com Market Data (oil spot price, WTI, Cushing, OK); www.goldprice.org (spot gold/silver); Oanda/FX Street (currency exchange rates).
© 2026 Broadridge Financial Solutions, Inc. All Rights Reserved.