We have gotten some relief from the volatile decline which ended on Christmas Eve, down 19.78% from 2018’s September 20th high. Five of the last six weeks have closed higher with Friday’s close leaving the S&P 500 up 15.12% from its holiday low but still 7.65% below the index high on September 20th. The pullback has brought price earnings multiples down to very reasonable levels.
With just under 50% of S&P 500 companies reporting fourth quarter profits, collective earnings per share have grown close to 18% compared to the same quarter last year. Nearly 70% have beaten analysts’ estimates. Collective revenue growth has been 6.1% with 61% of companies beating estimates. Looking ahead, estimates for Q1 2019 are for earnings growth in the low single digits as companies’ earnings comparisons lose the benefits of the 2018 tax cuts.
On the One Hand
- The Employment Cost Index registered a 0.7% increase in compensation costs for civilian workers. Wages and salaries, which make up over two-thirds of compensation costs, were up 0.6% for the month while benefit costs increased 0.7%. Wages and salaries for civilian workers were 3.1% higher for the year ending December 2018 compared to the increase of 2.5% in the previous year.
- The long- awaited November new home sales figures were released. After a steady downtrend since March, new home sales were 16.9% higher in November to an annual rate of 657,000. While down 7.7% from year ago levels, this recent strong showing is an indication housing may begin to add to the expansion.
- The headline January employment report showed an addition of 304,000 new jobs. A downward revision to December’s report of 90,000 jobs, nevertheless, showed a healthy 222,000 jobs added in that month. At the same time, November was revised upward to 196,000 from 176,000. The volatile report shows a healthy job market with the addition of an average 240,670 jobs per month over the period. The labor force participation rate increased to 63.2% in January from 63.1% in December. The increase in participation was largely responsible for the uptick in the unemployment rate to 4.0%.
- The ISM Manufacturing Index rose to 56.6% in January from an upwardly revised 54.3% print in December.
- The Commerce Department said Friday construction spending rose 0.8 percent in November after a 0.1 percent gain in October and a 1.8 percent fall in September. Release of the November construction report had been delayed because of the partial government shutdown.
On the Other Hand
- Consumer confidence declined in January for the third month in a row with a print of 120.2, down from 126.6 in December and October’s high of 137.9. Recent financial market volatility along with the government shutdown have shaken confidence and will be headwinds for upcoming hard data, consumer spending reports.
- Initial weekly unemployment claims shot up 53,000 to 253,000 moving the four-week moving average up 5,000 to 220,250. Continuing claims for the week rose 69,000 to 1.782 million. Initial weekly claims have not been over 250,000 since September 2017, however, some volatility can be expected after experiencing a 50 year low in these statistics.
- The Chicago PMI declined to 56.7 in January from 63.8 in December and 66.4 in November. Readings above 50.0 are an indication of expansion in the region.
- The University of Michigan consumer sentiment index for January was reported at 91.2, down sharply from its 98.3 December level.
All Else Being Equal
The past week’s economic data was split between good and bad news. With two of the four negative reports considered to be soft data (sentiment) rather than hard data (actual economic activity) concern about additional slowing is limited. The hard data reports over the coming weeks will be closely watched to see if the current cautious sentiment actually shows up in spending.
The FOMC met and took no action on interest rates. Jerome Powell’s press conference helped to confirm the Fed is monitoring economic data and is not locked into a plan to tighten rates further without evidence inflationary pressures increase.
The Atlanta Fed’s GDPNow estimate for Q4 2018 real growth has settled in at 2.5%. The New York Fed’s GDP Nowcast estimates Q4 2018 growth at 2.6% and Q1 2019 at 2.4%.
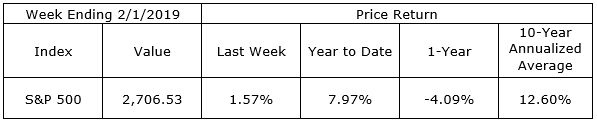
Last Week’s Market
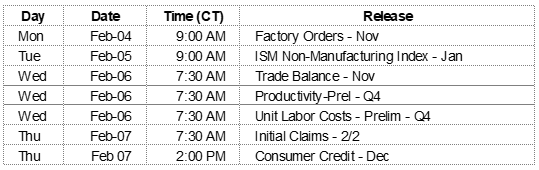
The Week Ahead
The information provided is obtained from sources believed to be reliable. Forecasts cannot be guaranteed. Past performance is not a guarantee of future results.