Stocks closed last week mixed, with the Nasdaq and the S&P 500 posting gains, while the Russell 2000, the Global Dow, and the Dow fell. Another round of strong corporate earnings data was enough to overcome investor concerns that rising inflation might accelerate the withdrawal of economic stimulus, while a resurgence of COVID-19 cases in Europe could lead to more lockdowns, stalling economic recovery. Ten-year Treasury yields ended the week where they began. Crude oil prices declined more than 2.5% to $78.76 per barrel. The dollar rose, while gold prices dipped lower. Consumer discretionary led the market sectors, advancing 3.8%, while information technology rose 2.4%. Energy fell 5.2%.
Stocks closed marginally lower to begin the week last Monday. The Russell 2000 dipped 0.5%, while the remaining benchmark indexes listed here fell by less than 0.1%. Ten-year Treasury yields increased to close at 1.62%. The dollar and crude oil prices advanced slightly. The market sectors were also mixed, with energy and utilities showing strength, while information technology, health care, and materials lagged.
Last Tuesday, equities rose following strong economic data. The majority of the benchmark indexes listed here posted solid gains after strong retail sales figures, a solid industrial production report, and favorable corporate earnings results. Only the Global Dow dipped lower, while the Nasdaq (0.8%), the S&P 500 (0.4%), the Russell 2000 (0.2%), and the Dow (0.2%) gained. Crude oil prices declined, while the dollar and 10-year Treasury yields climbed higher.
Last Tuesday’s momentum for stocks didn’t carry over to Wednesday, as each of the benchmark indexes ended the day in the red. The Russell 2000 led the decline, falling 1.2%, followed by the Dow (-0.6%), the Nasdaq (-0.3%), the S&P 500 (-0.3%), and the Global Dow (-0.3%). Along with rising inflation, housing starts slowed in October as builders wrestled with rising material prices and labor shortages. Ten-year Treasury yields and the dollar fell. Crude oil prices dipped below $80.00 per barrel, closing the day at around $78.00 per barrel. Consumer discretionary, real estate, and health care were the only sectors to advance. Energy (-1.7%) and financials (-1.1%) fell the furthest.
Consumer discretionary and information technology shares helped push the Nasdaq (0.5%) and the S&P 500 (0.3%) higher last Thursday. The Russell 2000 (-0.6%), the Global Dow (-0.4%), and the Dow (-0.2%) fell. Treasury yields and the dollar slid, while crude oil prices advanced marginally.
Wall Street was driven lower last Friday as economically sensitive market sectors, such as energy, financials, and health care, fell. Among the benchmark indexes listed here, only the Nasdaq was able to post a gain. The Russell 2000 and the Global Dow dipped 0.9%, while the Dow dropped 0.8%. The S&P 500 inched slightly lower by the close of trading. Ten-year Treasury yields and crude oil prices decreased, while the dollar advanced.
The national average retail price for regular gasoline was $3.399 per gallon on November 15, $0.011 per gallon less than the prior week’s price but $1.288 higher than a year ago. Gasoline production decreased during the week ended November 12, averaging 9.9 million barrels per day. U.S. crude oil refinery inputs averaged 15.4 million barrels per day during the week ended November 12 — 32,000 barrels per day more than the previous week’s average. Refineries operated at 87.9% of their operable capacity, up from the prior week’s level of 86.7%.
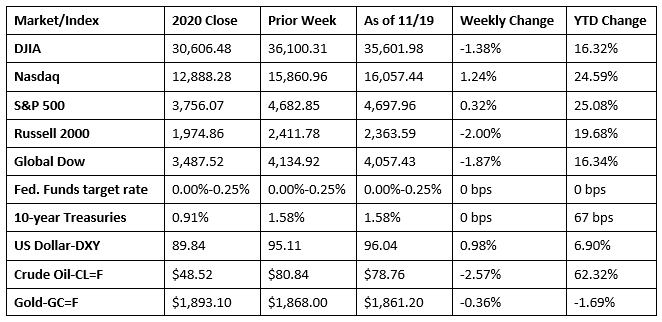
Chart reflects price changes, not total return. Because it does not include dividends or splits, it should not be used to benchmark performance of specific investments.
Last Week’s Economic News
- Retail sales continued to climb in October, increasing 1.7% after rising 0.8% (revised higher) in September. Retail sales have advanced 16.3% since October 2020. Retail trade sales rose 1.9% in October and are up 14.8% for the year. Gasoline station sales increased 3.9% in October and 46.8% from October 2020, while food services and drinking places were flat in October but have increased 29.3% from last year. This data seems to indicate that consumers are willing to spend, even at higher prices.
- Import prices rose 1.2% last month, the largest monthly increase since May 2021. Prices for imports have risen 10.7% since October 2020, the largest 12-month increase since the year ended in June 2021. Contributing to the import price increase was an 8.1% jump in petroleum prices. Natural gas prices advanced 19.7% in October. Overall, import fuel prices increased 86.7% over the past 12 months. Petroleum prices have risen 86.1% for the year, while natural gas prices have risen 134.0%. Export prices advanced 1.5% in October, the largest one-month increase since May 2021. Export prices have increased 18.0% over the 12 months ended in October. Agricultural export prices (1.0%) and nonagricultural prices (1.5%) increased in October.
- Industrial production rose 1.6% in October after falling 1.3% in September. Much of the October increase was reflective of the recovery from the effects of Hurricane Ida. Manufacturing output rose 1.2% last month, while factory output moved up 0.6%. Overall, total industrial production in October was 5.1% above its year-earlier level and the highest since December 2019.
- The number of building permits for new residential construction rose by 4.0% in October. Building permits for single-family construction increased 2.7%. Overall, the number of building permits issued for residential construction is 3.4% above the October 2020 rate. Housing starts dipped 0.7% last month, while single-family housing starts slid 3.9%. Housing completions were essentially unchanged in October from the previous month but are 8.4% below the October 2020 pace. Single-family home completions fell 1.7% in October.
- For the week ended November 13, there were 268,000 new claims for unemployment insurance, a decrease of 1,000 from the previous week’s level, which was revised up by 2,000. This is the lowest level for initial claims since March 14, 2020, when it was 256,000. According to the Department of Labor, the advance rate for insured unemployment claims for the week ended November 6 was 1.5%, a decrease of 0.1 percentage point from the previous week’s rate. The advance number of those receiving unemployment insurance benefits during the week ended November 6 was 2,080,000, a decrease of 129,000 from the prior week’s level, which was revised up by 49,000. This is the lowest level for insured unemployment since March 14, 2020, when it was 1,770,000. For comparison, last year at this time, there were 732,000 initial claims for unemployment insurance, and the rate for unemployment claims was 4.4%. During the last week of February 2020 (pre-pandemic), there were 219,000 initial claims for unemployment insurance, and the number of those receiving unemployment insurance benefits was 1,724,000. States and territories with the highest insured unemployment rates for the week ended October 30 were the District of Columbia (3.5%), Puerto Rico (3.5%), California (3.0%), Alaska (2.5%), Hawaii (2.5%), Illinois (2.5%), New Jersey (2.4%), Nevada (2.2%), the Virgin Islands (2.2%), and Oregon (1.9%). The largest increases in initial claims for the week ended November 6 were in Kentucky (+6,716), Ohio (+3,846), Tennessee (+2,411), Illinois (+1,893), and Michigan (+1,564), while the largest decreases were in California (-4,222), the District of Columbia (-1,794), and Louisiana (-1,028).
Eye on the Week Ahead
Thanksgiving week is filled with important economic reports, led by the second estimate of the third-quarter GDP. The initial estimate showed the economy expanded at a rate of 2.0%, well off the pace of 6.7% set in the second quarter. The report on personal income and outlays for October is also out this week. Although personal income fell 0.1% in September, consumer spending increased 0.6%, and consumer prices rose 0.3%. Finally, the housing sector is front and center with the latest data on sales of new and existing homes. Sales of both new and existing homes soared in September, increasing 14.0% and 7.0%, respectively.
The Week Ahead

The information provided is obtained from sources believed to be reliable. Forecasts cannot be guaranteed. Past performance is not a guarantee of future results.
© 2021 Broadridge Financial Solutions, Inc. All Rights Reserved.