Thanksgiving week proved to be a tumultuous one for investors. Each of the benchmark indexes listed here ended the week in the red following news of a new COVID variant in South Africa. In response, several countries, including the United States, initiated travel bans and tightened border controls. Crude oil prices fell 13.5% in the week as the new coronavirus strain sparked fears that lockdowns would hurt global demand. The yield on 10-year Treasuries fell 10 basis points to close below 1.55% for the first time in several sessions.
A selloff in tech shares pulled the Nasdaq down 1.3% to open the week last Monday. The Russell 2000 fell 0.5%, the S&P 500 dipped 0.3%, and the Global Dow lost 0.1%. The Dow inched up 0.1%. Treasury yields advanced nearly 600 basis points to close at 1.62%. Crude oil prices increased 0.5% to $76.35 per barrel. The dollar rose, while gold prices slipped. The market sectors were mixed, with energy, financials, consumer staples, and utilities climbing higher, while communication services, information technology, consumer discretionary, real estate, and health care fell.
The Nasdaq (-0.5%) fell for the second consecutive day last Tuesday as tech stocks continued to tumble. Energy and financials led the market sectors, helping to push the S&P 500 up 0.2%. The Russell 2000 inched 0.2% lower, while the Dow (0.6%) and the Global Dow (0.2%) advanced. Ten-year Treasury yields rose, as bond prices fell. Crude oil prices increased ahead of a move by several countries, including the United States and China, to tap their strategic oil supplies. The dollar was mixed.
Gains in real estate and energy stocks helped drive the S&P 500 higher last Wednesday. The Nasdaq reversed course and led the benchmark indexes listed here, while the Global Dow and the Russell 2000 also posted gains. The Dow was unchanged on the day. Ten-year Treasury yields and crude oil prices dipped lower. The dollar advanced. Investors got mixed reports last Wednesday. The Federal Reserve released the minutes from its early November meeting and noted that it “would not hesitate to take appropriate actions to address inflation pressures.” Since that meeting, inflation has continued to rise, which could prompt the Fed to quicken the pace of tapering its bond purchasing program. On the other hand, consumer spending rose in October from a month earlier. But the biggest news was that the number of weekly claims for unemployment benefits dipped to its lowest level since 1969 (see below).
Stocks tumbled on Black Friday, the major shopping day after Thanksgiving, as investors reacted to news of another coronavirus variant identified in South Africa. Each of the benchmark indexes listed here fell by at least 2.0%, led by the Russell 2000 (-3.7%), followed by the Global Dow (-2.7%), the Dow (-2.5%), the S&P 500 (-2.3%), and the Nasdaq (-2.2%). Crude oil prices suffered one of the largest single-day plunges, dropping 13.1% to close the day at $68.15 per barrel. Ten-year Treasury yields fell to 1.48%. The dollar dipped lower. The market fallout was widespread, with each of the market sectors closing in the red. Energy (-4.0%) and financials (-3.3%) fell the furthest.
The national average retail price for regular gasoline was $3.395 per gallon on November 22, $0.004 per gallon less than the prior week’s price but $1.293 higher than a year ago. Gasoline production increased during the week ended November 19, averaging 10.1 million barrels per day. U.S. crude oil refinery inputs averaged 15.6 million barrels per day during the week ended November 19 — 243,000 barrels per day more than the previous week’s average. Refineries operated at 88.6% of their operable capacity, up from the prior week’s level of 87.9%.
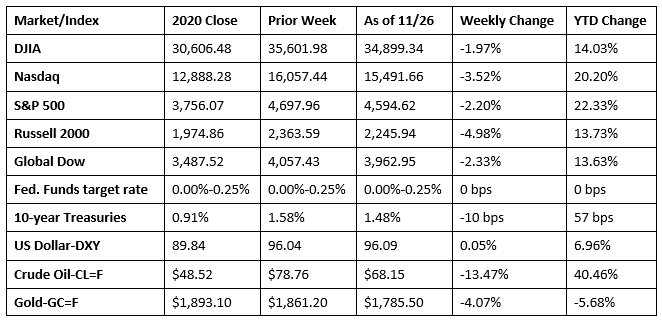
Chart reflects price changes, not total return. Because it does not include dividends or splits, it should not be used to benchmark performance of specific investments.
Last Week’s Economic News
- Gross domestic product increased at an annual rate of 2.1% in the third quarter of 2021, according to the second estimate released by the Bureau of Economic Analysis (BEA). GDP expanded at an annualized rate of 6.7% in the second quarter. The deceleration in GDP in the third quarter compared to the second was significantly impacted by a slowdown in personal consumption expenditures, which rose 1.7% in the third quarter compared to 12.0% in the second quarter. A few areas that increased in third-quarter GDP included private inventory investment (11.6% vs. -3.9% second quarter) and state and local government spending (4.7% vs. 0.2% second quarter). The personal consumption price index rose 5.3% in the third quarter.
- According to the latest data from the BEA, prices consumers spend on goods and services rose 0.6% in October and is up 5.0% over the past 12 months. Personal income increased 0.5%, while disposable personal income rose 0.3%. Consumer spending increased 1.3% in October.
- New orders for long-lasting durable goods fell for the second consecutive month in October, dropping 0.5%, following a 0.4% dip in September. Transportation equipment continued to be a drag on new orders, falling 2.6% in October after decreasing 2.8% the previous month. Excluding transportation, new orders for durable goods actually advanced 0.5%. Excluding defense, new orders rose 0.8% in October. Some items of note include new orders for communications equipment, which rose 7.9%; motor vehicles and parts advanced 4.8%; and new orders for electrical equipment, appliances, and components increased 1.2%. On the other hand, new orders for nondefense aircraft and parts fell 14.5%, defense aircraft and parts dropped 21.8%, and defense capital goods decreased 20.1%.
- The trade deficit for goods (excluding services) was $82.9 billion in October, down $14.1 billion, or 14.6%, from the September figure. Exports rose by $15.3 billion, or 10.7%, while imports increased $1.1 billion, or 0.5%. The jump in exports was spread across several sectors, led by industrial supplies (16.6%) and automotive vehicles (14.4%). Imports were driven higher by a 5.7% increase in automotive vehicles.
- According to the latest survey from the National Association of Realtors®, sales of existing homes rose 0.8% in October, following a 7.0% jump in September. Nevertheless, existing home sales were 5.8% lower than the October 2020 total. Housing inventory dipped 0.8% in October, representing a 2.4-month supply at the current sales pace. The October median existing-home price was $353,900, up slightly from the $351,200 price in September. Year over year, the median existing-home price was 13.1% over the October 2020 price. Sales of existing single-family homes climbed 1.3% last month but were down 5.8% from October 2020. The median existing single-family home price was $360,800 ($357,900 in September), up 13.5% from October 2020. The inventory of existing single-family homes for sale in October represented a 2.3-month supply, unchanged from the September figure.
- Sales of new single-family homes also rose in October, increasing 0.4% over the September rate. New home sales were 23.1% below the October 2020 pace. The median sales price of new houses sold in October was $407,700. The average sales price was $477,800. Inventory sits at a supply of 6.3 months at the current sales pace.
- For the week ended November 20, there were 199,000 new claims for unemployment insurance, a decrease of 71,000 from the previous week’s level, which was revised up by 2,000. This is the lowest level for initial claims since November 15, 1969, when it was 197,000. While encouraging, the drop in jobless claims may be attributable to several factors. Seasonal hires for the holiday shopping season increased the number of hires. This data was released a day early to accommodate Thanksgiving and is likely to be revised next week. And, customary layoffs related to end-of-year cost cutting are being replaced by businesses retaining employees in lieu of unfilled job openings. According to the Department of Labor, the advance rate for insured unemployment claims for the week ended November 13 was 1.5%, a decrease of 0.1 percentage point from the previous week’s revised rate. The advance number of those receiving unemployment insurance benefits during the week ended November 13 was 2,049,000, a decrease of 60,000 from the prior week’s level, which was revised up by 29,000. This is the lowest level for insured unemployment since March 14, 2020, when it was 1,770,000. For comparison, last year at this time, there were 762,000 initial claims for unemployment insurance, and the rate for unemployment claims was 4.2%. During the last week of February 2020 (pre-pandemic), there were 219,000 initial claims for unemployment insurance, and the number of those receiving unemployment insurance benefits was 1,724,000. States and territories with the highest insured unemployment rates for the week ended November 6 were the Virgin Islands (3.0%), Alaska (2.7%), the District of Columbia (2.7%), Puerto Rico (2.7%), California (2.6%), New Jersey (2.5%), Hawaii (2.1%), Nevada (2.1%), Illinois (1.9%), and New York (1.8%). The largest increases in initial claims for the week ended November 13 were in California (+4,690), Massachusetts (+2,269), Pennsylvania (+1,994), Minnesota (+1,202), and Wisconsin (+907), while the largest decreases were in Kentucky (-8,712), Tennessee (-4,001), Ohio (-3,315), Michigan (-3,230), and Illinois (-1,184).
Eye on the Week Ahead
The purchasing managers’ manufacturing and services reports for November are available this week. Respondents have noted that while the manufacturing and services sectors continue to expand, each area has been impacted by supply bottlenecks and labor shortages. Those issues are expected to remain through the year, which will further drive cost inflation. The November employment figures are also out at the end of this week. Over 500,000 new jobs were added in October, and hourly wages rose by 0.4%.
The Week Ahead

The information provided is obtained from sources believed to be reliable. Forecasts cannot be guaranteed. Past performance is not a guarantee of future results.
© 2021 Broadridge Financial Solutions, Inc. All Rights Reserved.