Wall Street closed the holiday-shortened week at record levels as investors seemed to speculate that the economic recovery could weather the growing number of coronavirus cases. The S&P 500 closed the week at a record high. The Nasdaq and the Russell 2000 ended up over 3.0%. Ten-year Treasury yields, gold, and crude oil prices climbed higher, while the dollar dipped lower. The market sectors were mixed, with consumer discretionary, communication services, and information technology leading the gainers.
Stocks slid last Monday. Fears that the Omicron variant could undercut the economic rebound, coupled with a setback to President Joe Biden’s social-spending bill, was enough to send stocks reeling. Each of the benchmark indexes listed here fell by at least 1.0%, with the small caps of the Russell 2000 dipping 1.6% to lead the declines. Ten-year Treasury yields inched higher, while the dollar and crude oil prices fell. Materials, consumer discretionary, financials, and industrials led the declines among the market sectors.
Equities jumped higher last Tuesday, reversing course from what had been the biggest three-day drop since September. While the Omicron variant continued to rage around the world, the White House indicated that widespread lockdowns were not anticipated and suggested that any negative impact of the latest virus strain on economic activity would be relatively short and shallow. The Russell 2000 and the Nasdaq each gained more than 2.0%, while the remaining benchmark indexes listed here advanced by at least 1.6%. Bond prices fell, sending yields higher. Crude oil prices, which had dipped below $69.00 per barrel, climbed to $71.46 per barrel. The dollar was relatively unchanged. Energy, consumer discretionary, information technology, and financials led the market sectors.
Wall Street ended last Wednesday in the black with several benchmark indexes closing near session highs. Information technology and consumer discretionary led the way on a day when no market sector lost value. The Nasdaq finished up 1.2%, followed by the S&P 500 (1.0%), the Russell 2000 and the Global Dow (0.9%), and the Dow (0.8%). Ten-year Treasury yields and the dollar dipped, while crude oil prices pushed higher, closing at $72.95 per barrel.
Thursday was the last trading day of the week, as the markets closed Friday in observance of the Christmas holiday. Despite low trading volume, each of the benchmark indexes listed here posted solid gains, with the Global Dow, the Nasdaq, and the Russell 2000 gaining 0.9%. The Dow and the S&P 500 advanced 0.6%. Treasury yields and crude oil prices climbed higher, while the dollar was unchanged. Consumer discretionary, materials, and industrials led the market sectors.
The national average retail price for regular gasoline was $3.295 per gallon on December 20, $0.020 per gallon less than the prior week’s price but $1.071 higher than a year ago. Gasoline production decreased during the week ended December 17, averaging 9.9 million barrels per day. U.S. crude oil refinery inputs averaged 15.8 million barrels per day during the week ended December 17 — 148,000 barrels per day more than the previous week’s average. Refineries operated at 89.6% of their operable capacity, the same level as the prior week.
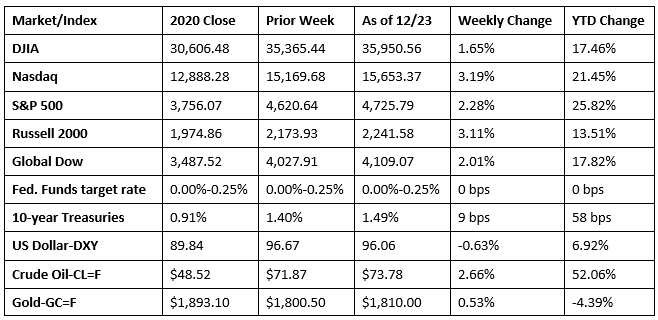
Chart reflects price changes, not total return. Because it does not include dividends or splits, it should not be used to benchmark performance of specific investments.
Last Week’s Economic News
- The economy accelerated at an annualized rate of 2.3%, according to the third and final estimate of the third-quarter gross domestic product. In the second quarter, the GDP increased 6.7%. The third-quarter advance reflected increases in private inventory investment, personal consumption expenditures, state and local government spending, and nonresidential fixed investment that were partly offset by decreases in exports, residential fixed investment, and federal government spending. Imports, which are a negative in the calculation of GDP, increased. The deceleration in third-quarter GDP compared to the second quarter was more than accounted for by a slowdown in personal consumption expenditures, as spending for goods declined (led by a decrease in motor vehicles and parts), while spending on services also fell (led by a decrease in food services and accommodations). The personal consumption expenditures price index increased 5.3% in the third quarter, compared with an increase of 6.5% in the second quarter. Excluding food and energy prices, the PCE price index increased 4.6% in the third quarter, compared with an increase of 6.1% in the previous quarter.
- Inflationary pressures continued to be felt in November. According to the latest data from the Bureau of Economic Analysis, prices for consumer goods and services rose 0.6% in November and are up 5.7% over the past 12 months. Excluding food and energy, prices were up 0.5% for November and 4.7% year over year. Personal income increased 0.4% in November as wages and salaries rose 0.5%. Consumer spending also advanced in November, climbing 0.6% following a 1.4% jump in October.
- Existing home sales rose for the third consecutive month in November. According to the latest data from the National Association of Realtors®, existing home sales accelerated at a rate of 1.9% from October. Sales are still 2.0% below their pace from a year ago. According to the report, the rise in sales may be attributable to buyers trying to make home purchases before mortgage rates rise further in the coming months. The median existing home price for all housing types in November was $353,900, the same price as in October, but 13.9% above the November 2020 price. Total housing inventory at the end of November sat at a 2.1-month supply, down from 2.4 months in October. Single-family home sales rose 1.6% in November. The median existing single-family home price was $362,600 in November, up from October’s price of $360,800.
- Sales of new single-family homes rose by 12.4% in November compared to the previous month. Nevertheless, sales of new single-family homes were 14.0% below the November 2020 estimate. The median sales price of new houses sold in November was $416,900 ($408,700 in October). The average sales price was $481,700 ($478,200 in October). Available inventory of new single-family homes for sale in November was 402,000, which represents a supply of 6.5 months at the current sales pace.
- New orders for manufactured durable goods in November increased $6.5 billion, or 2.5%, to $268.3 billion, according to the U.S. Census Bureau. This increase, up six of the last seven months, followed a 0.1% October increase. Excluding transportation, new orders increased 0.8%. Excluding defense, new orders increased 2.0%. Transportation equipment, up following two consecutive monthly decreases, led the increase, climbing $5.0 billion, or 6.5%, to $82.1 billion. Items of particular note include new orders for computers and electronic products, which rose 4.0%; communications equipment advanced 11.1%; and nondefense aircraft and parts jumped 34.1%. New orders for capital goods increased 5.5%, with defense capital goods advancing 16.0%. In November, shipments and unfilled orders rose 0.7%, while inventories advanced 0.6%.
- For the week ended December 18, there were 205,000 new claims for unemployment insurance, unchanged from the previous week’s level, which was revised down by 1,000. According to the Department of Labor, the advance rate for insured unemployment claims for the week ended December 11 was 1.4%, unchanged from the previous week’s rate. The advance number of those receiving unemployment insurance benefits during the week ended December 11 was 1,859,000, a decrease of 8,000 from the prior week’s level, which was revised up by 22,000. This is the lowest level for insured unemployment since March 14, 2020, when it was 1,770,000. For comparison, last year at this time there were 803,000 initial claims for unemployment insurance, and the rate for unemployment claims was 3.7%. During the last week of February 2020 (pre-pandemic), there were 219,000 initial claims for unemployment insurance, and the number of those receiving unemployment insurance benefits was 1,724,000. States and territories with the highest insured unemployment rates for the week ended December 4 were Alaska (3.1%), the Virgin Islands (2.9%), Puerto Rico (2.5%), California (2.4%), New Jersey (2.4%), the District of Columbia (2.2%), Minnesota (2.2%), Hawaii (1.9%), Illinois (1.8%), and Massachusetts (1.8%). The largest increases in initial claims for the week ended December 11 were in Missouri (+7,344), Kentucky (+3,600), Illinois (+1,171), Nebraska (+1,032), and Tennessee (+705), while the largest decreases were in New York (-8,157), North Carolina (-4,320), Texas (-4,086), Wisconsin (-3,214), and Oregon (-1,982).
Eye on the Week Ahead
There isn’t much economic data available this week, other than the advance report in the international trade in goods for November. The week between Christmas and New Year’s Day is typically a slow week for trading.
The Week Ahead

The information provided is obtained from sources believed to be reliable. Forecasts cannot be guaranteed. Past performance is not a guarantee of future results.
© 2021 Broadridge Financial Solutions, Inc. All Rights Reserved.