Wall Street closed lower last week as investors weighed mixed earnings data against increased certainty of aggressive interest rate hikes by the Federal Reserve. It was the third straight week of losses for the S&P 500 and the Nasdaq, while the Dow declined for the fourth consecutive week. The hawkish stance taken by the Fed has equities, particularly tech and growth shares, retreating. The small caps of the Russell 2000 fell the furthest last week, followed by the Nasdaq, the Global Dow, the S&P 500, and the Dow. Among the market sectors, only real estate and consumer staples posted weekly gains. Ten-year Treasury yields rose by 8 basis points as bond prices slid lower. Crude oil and gold prices declined, while the dollar advanced.
Stocks edged lower while bond yields rose to begin the week last Monday. The small caps of the Russell 2000 slid 0.7%, pulled lower by underperforming health care and industrials sectors. The remaining benchmark indexes listed here closed the day relatively flat, as the Dow, the Nasdaq, and the S&P 500 wavered between small gains and losses throughout the day. Ten-year Treasury yields rose 3.4 basis points to 2.86%. Crude oil prices added nearly $1.00 to reach $107.89 per barrel. The dollar and gold prices also advanced.
Wall Street rallied last Tuesday, buoyed by strong, first-quarter earnings data from several companies. Of the 48 companies in the S&P 500 that reported first-quarter earnings, 79% posted strong returns. The Nasdaq and the Russell 2000 each gained about 2.0%, followed by the S&P 500 (1.6%), the Dow (1.5%), and the Global Dow (0.4%). Crude oil prices waned on demand concerns, dropping nearly $6.00 to $102.5 per barrel. Bond prices continued to slide, pushing the yield on 10-year Treasuries up 5.1 basis points to 2.91%. The dollar edged higher, while gold prices dipped nearly $37.00 to $1,949.40 per ounce.
Equities ended last Wednesday mixed, with the Dow (0.7%), the Global Dow (0.6%), and the Russell 2000 (0.4%) advancing, while the Nasdaq (-1.2%) and the S&P 500 (-0.1%) lost value. First-quarter earnings data continued to be generally upbeat. Prices on 10-year Treasuries advanced, pulling yields down 7.3 basis points to 2.84%. Crude oil prices were flat, while the dollar and gold prices slid.
Despite an early-day surge on the heels of positive earnings data, stocks closed last Thursday lower after Federal Reserve Chair Jerome Powell said a 50-basis point rate hike is “on the table” when the central bank meets on May 3-4. The Russell 2000 dropped 2.3%, followed by the Nasdaq (-2.1%), the S&P 500 (-1.5%), the Dow (-1.1%), and the Global Dow (-0.8%). Crude oil prices climbed to $103.97 per barrel. The dollar inched higher, while gold prices slid. The yield on 10-year Treasuries rose 7.7 basis points to 2.91%.
Stocks closed last Friday lower to end a week that saw the market seesaw. Each of the benchmark indexes listed here fell more than 2.25%, with the Dow and the S&P 500 declining 2.8%, followed by the Russell 2000 and the Nasdaq, which slid 2.6%. Ten-year Treasury yields dipped slightly to end the day at 2.90%. Crude oil prices declined $2.14 to $101.65 per barrel. The dollar inched higher, while gold prices waned.
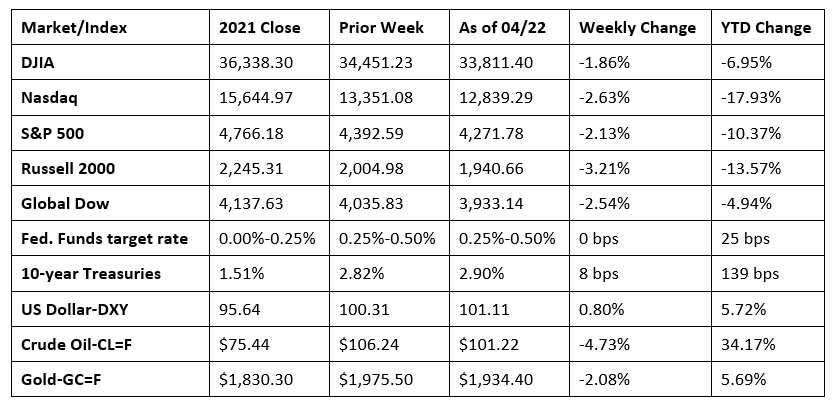
Chart reflects price changes, not total return. Because it does not include dividends or splits, it should not be used to benchmark performance of specific investments.
Last Week’s Economic News
- March saw the number of building permits for residential construction increase by 0.4%. However, single-family permits slid 4.8%. The number of privately owned housing starts rose 0.3% in March, driven higher by a 7.5% increase in multi-unit starts, which was offset by a 1.7% dip in single-family housing starts. Overall housing completions dipped 4.5% last month, and single-family housing completions dropped 6.4%.
- Existing home sales fell 2.7% in March, declining for the second straight month. Sales of existing homes are down 4.5% since March 2021. Total housing inventory at the end of March increased 11.8% from February but fell 9.5% from one year ago. Unsold inventory sits at a 2.0-month supply at the present sales pace, up from 1.7 months in February and down from 2.1 months in March 2021. The median existing-home price for all housing types in March was $375,300, up from $357,300 in February and ahead of the March 2021 price of $326,300. Sales of existing single-family homes also fell in March, down 2.7% from the February estimate and off 3.8% from March 2021. The median existing single-family home price in March was $382,000, an increase over the February median existing single-family home price of $363,800.
- The national average retail price for regular gasoline was $4.066 per gallon on April 18, $0.025 per gallon less than the prior week’s price but $1.211 higher than a year ago. Also as of April 18, the East Coast price decreased $0.04 to $3.93 per gallon; the Gulf Coast price was flat at $3.73 per gallon; the Midwest price slid $0.02 to $3.88 per gallon; the West Coast price decreased $0.04 to $5.10 per gallon; and the Rocky Mountain price edged up $0.01 to $4.15 per gallon. Residential heating oil prices averaged $3.86 per gallon, about $0.54 per gallon more than the prior week’s price. U.S. crude oil refinery inputs averaged 15.7 million barrels per day during the week ended April 15, which was 194,000 barrels per day more than the previous week’s average. During the week ended April 15, refineries operated at 91.0% of their operable capacity, and gasoline production increased, averaging 9.8 million barrels per day.
- For the week ended April 16, there were 184,000 new claims for unemployment insurance, a decrease of 2,000 from the previous week’s level, which was revised up by 1,000. According to the Department of Labor, the advance rate for insured unemployment claims for the week ended April 9 was 1.0%, a decrease of 0.1 percentage point from the previous week’s rate. The advance number of those receiving unemployment insurance benefits during the week ended April 9 was 1,417,000, a decrease of 58,000 from the previous week’s level. This is the lowest level for insured unemployment since February 21, 1970, when it was 1,412,000. States and territories with the highest insured unemployment rates for the week ended April 2 were New Jersey (2.3%), California (2.2%), Alaska (2.0%), Minnesota (2.0%), Illinois (1.7%), Massachusetts (1.7%), New York (1.7%), Rhode Island (1.7%), Pennsylvania (1.5%), and the Virgin Islands (1.5%).The largest increases in initial claims for the week ended April 9 were in Missouri (+7,194), Michigan (+5,950), California (+3,215), Indiana (+3,193), and Texas (+2,617), while the largest decreases were in Ohio (-3,886), Wisconsin (-1,159), Oklahoma (-776), Utah (-270), and Hawaii (-219).
Eye on the Week Ahead
There’s plenty of important economic data out this week, headlined by the initial estimate for the first-quarter gross domestic product. The March report on personal income and outlays is also available at the end of the week. Personal income rose 0.5% in February, while consumer spending increased 0.2%. Consumer prices advanced 0.6% in February and were up 6.4% since February 2021.
The Week Ahead

The information provided is obtained from sources believed to be reliable. Forecasts cannot be guaranteed. Past performance is not a guarantee of future results.
© 2021 Broadridge Financial Solutions, Inc. All Rights Reserved.