Stocks closed higher last week, ending a seven-week slide. More upbeat corporate news and favorable economic data helped quell investor angst, at least temporarily. The S&P 500 posted its best week since November 2020 and is headed for a positive month in May. A few factors may have helped increase investor confidence. Several large retailers released quarterly earnings results that largely exceeded Wall Street estimates. The personal consumption expenditures price index (the Fed’s preferred inflation indicator) rose 0.2% in April after increasing 0.9% in March, signaling that inflationary pressures may be subsiding. In addition to the S&P 500, the Dow, the Nasdaq, and the Russell 2000 gained more than 6.0% by week’s end. Nevertheless, to put the latest drought into perspective, the S&P 500 and the Nasdaq hadn’t suffered seven consecutive weekly declines since the dot.com bubble burst in early 2000. And the Dow’s eight-week slide was the longest since 1932.
Wall Street did something unusual last Monday: It opened the week on an uptick. Each of the benchmark indexes listed here posted solid gains, led by the Dow and the Global Dow (2.0%), followed by the S&P 500 (1.9%), the Nasdaq (1.6%), and the Russell 2000 (1.1%). Ten-year Treasury yields jumped 7.2 basis points to 2.85%. Crude oil prices climbed to $110.66 per barrel. The dollar slid lower, while gold prices advanced. The financial sector made the biggest gains as several major banks saw their stocks record notable gains.
Last Tuesday saw the Dow inch up 0.2%, while the remaining market indexes ended the day in the red. A tech sell-off pulled the Nasdaq down 2.4%. The Russell 2000 slid 1.6%, the S&P 500 dropped 0.8%, and the Global Dow declined 0.3%. Unfavorable economic news weighed on investors, following a substantial drop in new home sales last month (see below). Ten-year Treasury yields fell 9.9 basis points to 2.76%. Crude oil prices dipped to $109.72 per barrel and the dollar declined against a bucket of currencies.
Stocks ended higher last Wednesday following a choppy day of trading. The Nasdaq rebounded from last Tuesday’s decline, gaining 1.5%. The Russell 2000 jumped 2.0%. The Global Dow advanced 0.5%. The large caps of the S&P 500 (1.0%) and the Dow (0.6%) also advanced. Crude oil prices rose $1.07 to $110.84 per barrel. Ten-year Treasuries dipped 11 basis points to 2.74%. The dollar climbed higher, while gold prices fell. Investors gained some solace following the release of the minutes from the last Federal Reserve meeting. The Fed gave no indication that a more hawkish course of action is in the offing, lending credence to the expectation that the next two rate hikes will be no more than 50 basis points each.
Equities closed higher last Thursday for the second day in a row. Consumer shares led gains as several retailers raised their sales projections. The Nasdaq again led the surge, adding 2.7%, followed by the Russell 2000 (2.2%), the S&P 500 (2.0%), the Dow (1.6%), and the Global Dow (1.4%). The yield on 10-year Treasuries inched up to 2.75%. Crude oil prices jumped more than $3.50 to $113.87 per barrel. The dollar fell against a bucket of currencies. Gold prices advanced.
Stocks climbed higher last Friday, with each of the benchmark indexes listed here adding notable gains. The Nasdaq jumped 3.3%, the S&P 500 added 2.5%, the Russell 2000 rose 2.7%, the Dow gained 1.8%, and the Global Dow increased 1.4%. Investors were buoyed by more upbeat corporate results and economic indications that inflation may be slowing. Crude oil prices continued to increase, adding another $1.00 to reach $115.10 per barrel. Ten-year Treasury yields slid 13 basis points to 2.74%. The dollar declined for the second consecutive day, while gold prices climbed higher for the second day in a row.
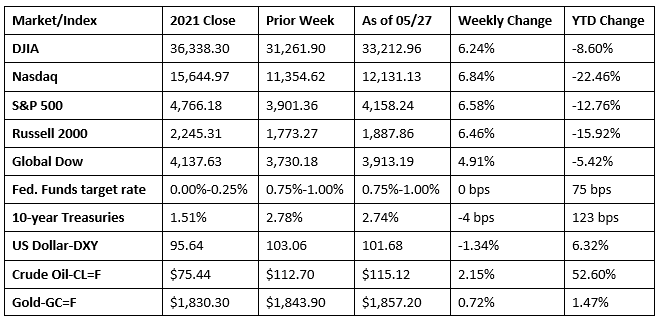
Chart reflects price changes, not total return. Because it does not include dividends or splits, it should not be used to benchmark performance of specific investments.
Last Week’s Economic News
- The second estimate of first-quarter gross domestic product showed that the economy contracted at an annualized rate of -1.5%. The decrease in GDP reflected decreases in private inventory investment, exports, federal government spending, and state and local government spending; imports, which are a subtraction in the calculation of GDP, increased. However, consumer spending, as measured by personal consumption expenditures, increased 3.1% in the first quarter. On the other hand, exports fell 5.4%, while imports increased 18.3%. The personal consumption expenditures price index (a measure of price inflation) increased 7.0% in the first quarter. Excluding food and energy prices, the PCE price index increased 5.1% (revised).
- According to the latest report on personal income and outlays, inflationary pressures waned in April as the personal consumption expenditures price index rose 0.2% after increasing 0.9% in March. Since April 2021, consumer prices have risen 6.3%. Personal consumption expenditures, a measure of consumer spending, increased 0.9% following a 1.4% advance in March. Personal income increased 0.4% in April, and disposable (after-tax) personal income rose 0.3%.
- The international trade in goods deficit was $105.9 billion in April, a decrease of 15.9% from March. Exports rose 3.1%, while imports fell 5.0%.
- The housing sector has slowed considerably from the pace set last year as rising home prices and mortgage rates have impacted the market. New single-family home sales fell 16.6% in April. Since April 2021, sales of new single-family homes are down 26.9%. The median sales price of new houses sold in April 2022 was $450,600 ($435,000 in March). The average sales price was $570,300 ($522,500 in March). Inventory of new single-family homes for sale sits at a supply of 9.0 months at the current sales rate, well off the April 2021 pace of 4.7 months.
- New durable goods orders increased 0.4% in April following a 0.6% advance in March. Durable goods orders have increased in six of the last seven months. Excluding transportation, new orders increased 0.3%. Excluding defense, new orders increased 0.3%. Transportation equipment, up following two consecutive monthly decreases, led the April increase after advancing 0.6%. Since April 2021, new orders for durable goods have risen 10.5%. New orders for nondefense capital goods used in the production of final products rose 0.4% in April. New orders for defense capital goods jumped 2.5% last month.
- The national average retail price for regular gasoline was $4.593 per gallon on May 23, $0.102 per gallon above the prior week’s price and $1.573 higher than a year ago. Also as of May 25, the East Coast price increased $0.10 to $4.53 per gallon; the Gulf Coast price rose $0.10 to $4.26 per gallon; the Midwest price climbed $0.10 to $4.40 per gallon; the West Coast price increased $0.13 to $5.49 per gallon; and the Rocky Mountain price increased $0.05 to $4.33 per gallon. Residential heating oil prices averaged $3.74 per gallon on May 20, about $0.18 per gallon less than the prior week’s price. According to the U.S. Energy Information Administration, the average retail price of regular gasoline is the highest inflation-adjusted price since 2012 and the fourth highest price on record. The high price of gasoline is currently driven by several factors, including the price of crude oil, the effects of Russia’s full-scale invasion of Ukraine, and U.S. gasoline demand growth outpacing refinery runs, resulting in large gasoline inventory draws.
- For the week ended May 21, there were 210,000 new claims for unemployment insurance, a decrease of 8,000 from the previous week’s level. According to the Department of Labor, the advance rate for insured unemployment claims for the week ended May 14 was 1.0%, an increase of 0.1 percentage point from the previous week’s rate. The advance number of those receiving unemployment insurance benefits during the week ended May 14 was 1,346,000, an increase of 31,000 from the previous week’s level, which was revised down by 2,000. States and territories with the highest insured unemployment rates for the week ended May 7 were California (2.0%), New Jersey (1.9%), Alaska (1.7%), New York (1.4%), Puerto Rico (1.4%), Rhode Island (1.3%), Massachusetts (1.3%), Minnesota (1.2%), Illinois (1.2%), Pennsylvania (1.2%), and the Virgin Islands (1.2%). The largest increases in initial claims for the week ended May 14 were in Kentucky (+6,712), California (+1,968), Illinois (+1,742), Ohio (+1,189), and Florida (+629), while the largest decreases were in Michigan (-384), Georgia (-325), Colorado (-301), Arizona (-278), and the District of Columbia (-251).
Eye on the Week Ahead
The employment figures for May are out at the end of this week. April saw over 400,000 new jobs added and the unemployment rate dipped to 3.6%. It will be interesting to see whether the labor sector remains strong in the face of the anticipated slowdown in the economy due to rising interest rates.
The Week Ahead

The information provided is obtained from sources believed to be reliable. Forecasts cannot be guaranteed. Past performance is not a guarantee of future results.
© 2021 Broadridge Financial Solutions, Inc. All Rights Reserved.