Investors swallowed modest losses last week as the stock market served up another disappointing performance. Each of the benchmark indexes listed here lost value, with the S&P 500 declining 1.2%, the Nasdaq pulling back 1.0%, and the Dow falling 0.9%. The Global Dow fell 0.8% and the Russell 2000 dipped 0.3%. Strong employment data seems to support the Fed’s plan to raise the federal funds rate quickly to help fight inflation, leaving investors to fret about the impact on economic growth.
Last Tuesday, rising crude oil prices and bond yields pulled stocks lower to start the holiday-shortened week. The Dow slid 0.7%, the S&P 500 lost 0.6%, and the Nasdaq slipped 0.4%. The small caps of the Russell 2000 advanced 0.6%. Ten-year Treasury yields added 12 basis points to close at 2.82%. Crude oil prices fell marginally. The dollar inched higher, while gold prices continued to tumble.
Wall Street began June on a sour note with each of the benchmark indexes listed here declining. Last Wednesday, the Global Dow, the Nasdaq, and the S&P 500 lost nearly 0.8%, while the Dow and the Russell 2000 dropped 0.5%. Yields on 10-year Treasuries rose 9 basis points to 2.93%. Crude oil prices changed little from the prior day. The dollar and gold prices advanced.
Equities rebounded last Thursday, with dip buyers targeting reduced megacap stocks. The Nasdaq jumped 2.7%, followed by the Russell 2000 (2.3%), the S&P 500 (1.8%), the Dow (1.3%), and the Global Dow (0.9%). Crude oil prices advanced $2.12, rising to $117.38 per barrel. However, OPEC+ agreed to increase crude output in July and August to compensate for the drop in production due to sanctions placed on Russia. Ten-year Treasury yields dipped about 2 basis points to 2.91%. The dollar declined, while gold prices climbed higher for the second straight day.
Yet another decline in tech shares dragged down the equity market last Friday, with the Nasdaq falling 2.5% and the S&P 500 dropping 1.6%. The Dow (-1.0%), the Russell 2000 (-0.8%), and the Global Dow (-0.6%) also ended the day in the red. Ten-year Treasury yields ticked up to 2.95%. Crude oil prices and the dollar advanced, while gold prices retreated.
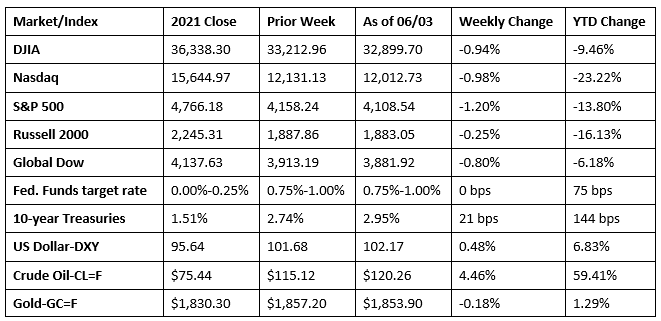
Chart reflects price changes, not total return. Because it does not include dividends or splits, it should not be used to benchmark performance of specific investments.
Last Week’s Economic News
- There were 390,000 new jobs added in May, and the unemployment rate remained at 3.6% for the third straight month, according to the latest report from the Bureau of Labor Statistics. The number of unemployed persons was essentially unchanged at 6.0 million. Both the total number of unemployed and the unemployment rate are little different from their values in February 2020 (5.7 million and 3.5%, respectively), prior to the COVID-19 pandemic. Both the labor force participation rate, at 62.3%, and the employment-population ratio, at 60.1%, were little changed over the month. Average hourly earnings rose by $0.10, or 0.3%, to $31.95 in May. Over the past 12 months, average hourly earnings have increased by 5.2%. In May, the average work week was 34.6 hours for the third month in a row.
- Manufacturing accelerated in May, but at a slower pace than in April. According to the S&P Global US Manufacturing Purchasing Managers’ Index™ report, while operating conditions continued to improve, the rate of growth in the manufacturing sector eased to the softest since January as expansions in output, new orders, and stocks of purchases slowed. However, demand remained robust, with firms increasing their hiring activity and backlogs of work expanding. Nevertheless, business confidence slipped to the lowest level since October 2020, as supply constraints and inflationary pressures hampered growth. Price growth increased at its fastest rate in six months, with manufacturers passing on higher expenses to customers.
- The services sector also expanded in May, but at the slowest rate in four months, amid the slowest increase in new business since last September, as well as ongoing labor and supply constraints. Meanwhile, pressure on capacity continued to build as backlogs of work rose steeply again. In response, firms expanded their workforce numbers sharply.
- According to the latest Job Openings and Labor Turnover report, the number of job openings fell 455,000 in April to 11.4 million. The largest decreases in job openings were in health care and social assistance (-266,000), retail trade (-162,000), and accommodation and food services (-113,000). The largest increases were in transportation, warehousing, and utilities (+97,000); nondurable goods manufacturing (+67,000); and durable goods manufacturing (+53,000). The number of hires in April, at 6.6 million, was little changed from March. The number of layoffs and discharges edged down to a series low of 1.2 million. Over the 12 months ended in April, hires totaled 78.0 million and separations totaled 71.6 million, yielding a net employment gain of 6.4 million.
- The national average retail price for regular gasoline was $4.624 per gallon on May 30, $0.031 per gallon above the prior week’s price and $1.597 higher than a year ago. Also as of May 30, the East Coast price increased $0.02 to $4.55 per gallon; the Gulf Coast price fell $0.04 to $4.22 per gallon; the Midwest price climbed $0.06 to $4.46 per gallon; the West Coast price increased $0.07 to $5.56 per gallon; and the Rocky Mountain price increased $0.12 to $4.45 per gallon. Residential heating oil prices averaged $4.00 per gallon on May 27, about $0.26 per gallon more than the prior week’s price. According to the U.S. Energy Information Administration June 2 report on petroleum and other liquids, international oil and natural gas companies reported increased cash flow and higher reserves in 2021. These companies directed more of their financial resources toward debt reduction, dividend increases, and merger and acquisition opportunities than toward capital expenditures for production growth.
- For the week ended May 28, there were 200,000 new claims for unemployment insurance, a decrease of 11,000 from the previous week’s level, which was revised up by 1,000. According to the Department of Labor, the advance rate for insured unemployment claims for the week ended May 21 was 0.9%, a decrease of 0.1 percentage point from the previous week’s rate. The advance number of those receiving unemployment insurance benefits during the week ended May 21 was 1,309,000, a decrease of 34,000 from the previous week’s level, which was revised down by 3,000. This is the lowest level for insured unemployment since December 27, 1969, when it was 1,304,000. States and territories with the highest insured unemployment rates for the week ended May 14 were California (2.0%), New Jersey (1.9%), Alaska (1.7%), New York (1.4%), Puerto Rico (1.4%), Illinois (1.2%), Massachusetts (1.2%), Pennsylvania (1.2%), Rhode Island (1.2%), and the Virgin Islands (1.2%). The largest increases in initial claims for the week ended May 21 were in Missouri (+1,178), Georgia (+606), Mississippi (+481), Texas (+426), and North Carolina (+322), while the largest decreases were in California (-6,119), Illinois (-4,082), Kentucky (-3,578), New York (-1,450), and Michigan (-524).
Eye on the Week Ahead
The Consumer Price Index for May is available this week. Consumer prices rose 0.3% in April and were up 8.3% from April 2021. However, price inflation may be slowing, as the April increase was much lower than March’s 1.2% jump.
The Week Ahead

The information provided is obtained from sources believed to be reliable. Forecasts cannot be guaranteed. Past performance is not a guarantee of future results.
© 2021 Broadridge Financial Solutions, Inc. All Rights Reserved.