Stocks ended a turbulent week generally lower as investors digested the latest inflation data and the Federal Reserve’s possible response. Of the benchmark indexes listed here, only the Dow and the Global Dow managed to eke out gains by the end of last week. Inflation rose by only 0.1% in November, according to the latest data from the Bureau of Economic Analysis (see below). Investors are hoping this is the latest sign that inflationary pressures have peaked, which could influence the Fed to scale back its interest-rate hikes. However, news that China is experiencing another surge in COVID cases could prompt more government-imposed lockdowns, which would impact the global economy. Ten-year Treasury yields advanced the most since early April. The dollar edged lower, while gold prices climbed higher. Crude oil prices increased for the second week in a row, nearing $80.00 per barrel.
Stocks closed last Monday lower for the fourth straight session. The S&P 500 hit its lowest level in more than a month after declining 0.9%. The Nasdaq dropped 1.5%, the Russell 2000 fell 1.4%, the Dow dipped 0.5%, and the Global Dow slid 0.2%. Bond prices fell, driving the yield on 10-year Treasuries up 9.9 basis points to 3.58%. Crude oil prices rose nearly 2.0% to reach $75.67 per barrel. The dollar was flat, while gold prices fell marginally.
Last Tuesday saw stocks barely snap a four-day losing streak. The Global Dow (0.7%) and the Russell 2000 (0.5%) led the benchmark indexes listed here, followed by the Dow (0.3%) and the S&P 500 (0.1%). The tech-heavy Nasdaq ended the day flat. Ten-year Treasury yields added 10.3 basis points to close at 3.66%. The dollar slipped lower, while gold prices advanced. Crude oil prices gained marginally, ending the session at about $76.02 per barrel.
Stocks rallied for the second straight day last Wednesday. The S&P 500 rose for the second day in a row, while the Nasdaq had its best day since late November. Improvement in consumer confidence and some strong earnings supported risk sentiment. Among the benchmark indexes listed here, only the Global Dow (1.1%) did not advance at least 1.5% by the close of trading. Ten-year Treasury yields were flat, crude oil prices climbed higher for the third day in a row, the dollar advanced, while gold prices dipped marginally lower.
Wall Street saw its mini-rally end last Thursday as each of the benchmark indexes listed here lost value. Solid economic data increased worries that the Federal Reserve will extend its aggressive monetary policy longer than hoped. The Nasdaq led the declining indexes, falling 2.2%, followed by the S&P 500 (-1.4%), the Russell 2000 (-1.3%), the Dow (-1.1%), and the Global Dow (-0.7%). Ten-year Treasuries edged lower, while the dollar moved higher. Crude oil prices ended their rally, dipping minimally to $78.26 per barrel. Gold prices lost 1.4% on the day.
Stocks closed last Friday on an uptick, with each of the benchmark indexes listed here claiming gains. The S&P 500 advanced 0.6% to lead the indexes, followed by the Dow (0.5%), the Russell 2000 (0.4%), the Global Dow (0.3%), and the Nasdaq (0.2%). Ten-year Treasury yields added 8.2 basis points to close at 3.75%. The dollar edged lower, while gold prices rose nearly 0.5%. Crude oil prices gained $2.16 to close at around $79.65 per barrel.
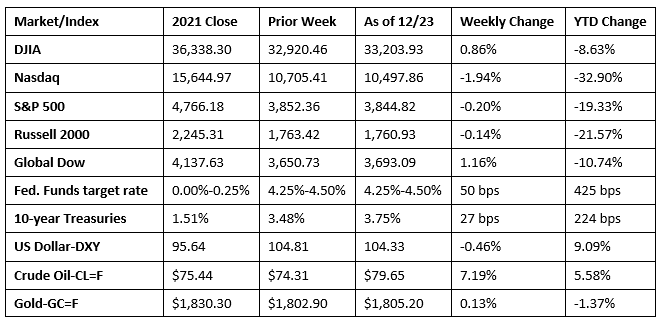
Chart reflects price changes, not total return. Because it does not include dividends or splits, it should not be used to benchmark performance of specific investments.
Last Week’s Economic News
- The final estimate for third-quarter gross domestic product showed the economy accelerated at an annual rate of 3.2%, exceeding expectations. GDP declined 1.6% and 0.6%, respectively, in the first and second quarters. The increase in GDP was driven in part by advances in exports; federal, state, and local government spending; consumer spending; and nonresidential fixed investment that were partly offset by decreases in residential fixed investment and private inventory investment. Imports, which are a negative in the calculation of GDP, decreased. The personal consumption expenditures price index, a measure of inflation, increased 4.3% in the third quarter, lower than the 7.1% advance in the second quarter.
- Personal income and disposable (after-tax) income rose 0.4% in November, according to the latest data from the Bureau of Economic Analysis. Consumer spending, as measured by personal consumption expenditures, rose 0.1%. Consumer prices edged up 0.1% in November. Prices, less food and energy, increased 0.2%. Since November 2021, consumer prices have increased 5.5%, lower than the 12 months ended in October (6.1%).
- The housing sector continued to weaken in November. Sales of existing homes fell for the tenth consecutive month after declining 7.7% in November. Year over year, sales are down 35.4%. Single-family homes sales also dropped in November, falling 7.6% from the previous month and 35.2% since November 2021. According to the National Association of Realtors®, the rapid increase in mortgage rates coupled with low inventories have hurt housing affordability and brought sales activity to levels resembling those that existed during the COVID-19 lockdown. Total housing inventory in November represented a supply of 3.3 months, unchanged from October. The median existing home price for all housing types in November was $370,700, a decrease of 2.2% from October ($378,800) but 3.5% above the November 2021 price ($358,200). The median existing single-family home price was $376,700 in November, down from $384,600 in October but up from the November 2021 price of $365,000.
- Sales of new single-family homes increased for the second straight month in November, advancing 5.8% above the revised October rate. However, sales are down 15.3% from November 2021. Inventory of available single-family homes for sale stood at 8.6 months, down from the October rate of 9.3 months. The median sales price of new single-family homes sold in November was $471,200 ($484,700 in October), while the average sales prices was $543,600 ($533,400) in October.
- The number of issued building permits and housing starts declined in November from the previous month. Authorized building permits were 11.2% below the October rate and 22.4% under the November 2021 pace. In November, issued building permits for single-family home construction were 7.1% under the October figure. Housing starts in November were 0.5% below the October estimate and 16.4% under the November 2021 rate. Single-family housing starts were 4.1% less than the previous month’s tally. Home completions rose by 10.8% in November and were 6.0% higher than the prior year’s total. In November, single-family home completions were 9.5% above the October rate.
- New orders for manufactured durable goods decreased 2.1% in November following three consecutive monthly increases. Excluding transportation, new orders increased 0.2%. Excluding defense, new orders decreased 2.6%. Transportation equipment drove the decrease in new orders, falling 6.3% following three consecutive monthly increases.
- Retail prices for regular gasoline continued to slide last week. According to the U.S. Energy Administration, the national average retail price for regular gasoline was $3.120 per gallon on December 19, $0.119 per gallon below the prior week’s price and $0.175 lower than a year ago. Also as of December 19, the East Coast price decreased $0.107 to $3.118 per gallon; the Gulf Coast price fell $0.086 to $2.641 per gallon; the Midwest price declined $0.123 to $2.911 per gallon; the West Coast price dropped $0.164 to $3.983 per gallon; and the Rocky Mountain price decreased $0.141 to $3.086 per gallon. Residential heating oil prices averaged $4.606 per gallon on December 19, $0.261 above the previous week’s price and $1.262 per gallon more than a year ago.
- For the week ended December 17, there were 216,000 new claims for unemployment insurance, an increase of 2,000 from the previous week’s level, which was revised up by 3,000. According to the Department of Labor, the advance rate for insured unemployment claims for the week ended December 10 was 1.2%, unchanged from the previous week’s rate. The advance number of those receiving unemployment insurance benefits during the week ended December 10 was 1,672,000, a decrease of 6,000 from the previous week’s level, which was revised up by 7,000. States and territories with the highest insured unemployment rates for the week ended December 3 were Alaska (2.3%), Puerto Rico (2.1%), California (2.0%), New Jersey (2.0%), Montana (1.7%), Minnesota (1.7%), New York (1.6%), Rhode Island (1.6%), Massachusetts (1.5%), and Washington (1.5%). The largest increases in initial claims for unemployment insurance for the week ended December 10 were in Connecticut (+471), the District of Columbia (+237), Nevada (+157), Kentucky (+153), and Illinois (+138), while states with the largest decreases were in New York (-7,134), California (-4,830), Georgia (-4,273), Texas (-3,954), and Pennsylvania (-2,669).
Eye on the Week Ahead
There is very little economic data released during the week between Christmas and New Year’s Day. In addition, trading is customarily muted as investors take a break while preparing for the new year.
The Week Ahead

The information provided is obtained from sources believed to be reliable. Forecasts cannot be guaranteed. Past performance is not a guarantee of future results.
© 2021 Broadridge Financial Solutions, Inc. All Rights Reserved.