The market returned mixed results last week, with the Russell 2000 and the Nasdaq advancing, while the Global Dow, the Dow, and the S&P 500 shed value. Bond prices fell, pushing 10-year Treasury yields up for the fourth straight week. The dollar advanced, while gold prices dropped. Crude oil prices ticked higher after slipping the prior week. Overall, another lackluster September came to a close with the Federal Reserve projecting higher interest rates for longer despite data that shows inflation is cooling.
Stocks rebounded last Monday following the prior week’s slump. Other than the Global Dow (-0.3%), each of the benchmark indexes listed here gained ground, led by the Nasdaq (0.5%), followed by the S&P 500 and the Russell 2000 (0.4%), and the Dow (0.1%). Energy, materials, and consumer discretionary led the sectors. Ten-year Treasury yields added 10.4 basis points to close at 4.54%, the highest level since 2007. Crude oil prices were flat, settling at about $89.95 per barrel. The dollar rose 0.4%, while gold prices fell 0.6%.
Wall Street couldn’t maintain momentum from the day before as stocks tumbled last Tuesday. The Nasdaq slid 1.6%, the S&P 500 lost 1.5%, the Russell 2000 declined 1.3%, the Dow dipped 1.1%, and the Global Dow fell 1.0%. For perspective, the S&P 500 closed at its lowest level since early June, while the Dow had its largest single-day percentage decline since March. Ten-year Treasury yields, on the other hand, reached new highs after closing at 4.55%. Crude oil prices, which hovered around $90.59 per barrel, remain near 10-month highs. The stock market downturn extended to a fourth week, impacted by the continued hawkish Fed monetary policy, rising crude oil and gasoline prices, and stubborn inflation. September’s decline in consumer confidence has not helped matters. And to add to investor angst, the Federal Government is facing a shutdown.
The Dow (-0.2%) and the Global Dow (-0.3%) slid lower last Wednesday, while the Russell 2000 (1.0%) and the Nasdaq (0.2%) advanced. The large caps of the S&P 500 ended the day where they began. Ten-year Treasury yields, pushed higher by sagging bond prices, added 6.8 basis points to close at 4.62%, the highest level since 2007. Crude oil prices jumped 3.6%, settling at $93.63 per barrel. The dollar rallied to its highest level in nearly a year, while gold prices dipped lower.
Stocks maintained momentum from the previous day, climbing higher last Thursday. Each of the benchmark indexes listed here posted gains, led by the Russell 2000 (0.9%), followed by the Nasdaq (0.8%), the S&P 500 (0.6%), and the Dow and the Global Dow (0.4%). Ten-year Treasury yields declined 2.9 basis points as bond prices inched higher. The 10-year Treasury yield settled at 4.59% on Thursday. Crude oil prices gave back some of last Wednesday’s gains, falling 2.1% to $91.76 per barrel. The dollar and gold prices dipped lower.
Equities ended mostly lower last Friday, with a push from megacaps lifting the Nasdaq up 0.1%. The Russell 2000 and the Dow lost 0.5%, while the Global Dow and the S&P 500 slid 0.3%. Ten-year Treasury yields dipped 2.4 basis points to 4.57%. Crude oil prices fell nearly 1.0% to settle at $90.87 per barrel. The dollar and gold prices declined.
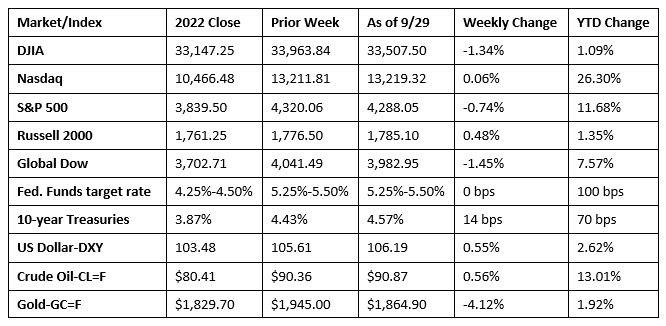
Chart reflects price changes, not total return. Because it does not include dividends or splits, it should not be used to benchmark performance of specific investments.
Last Week’s Economic News
- The economy grew at an annualized rate of 2.1% in the second quarter according to the third and final estimate of gross domestic product. GDP accelerated at a rate of 2.2% in the first quarter. The personal consumption expenditures (PCE) price index increased 2.5%. Excluding food and energy prices, the PCE price index increased 3.7%. Consumer spending, as measured by the personal consumption expenditures index, rose 0.8%. Spending on goods increased 0.5%, while spending on services climbed 1.0%. Residential fixed investment declined 2.2%, while nonresidential (business) fixed investment jumped 7.4%. Exports fell 9.3%. Imports, which are a negative in the calculation of GDP, declined 7.6%.
- Prices consumers paid for goods and services, as measured by the personal consumption expenditures (PCE) price index, rose 0.4% in August following a 0.2% increase in July. Excluding food and energy, prices inched up 0.1%. Energy prices advanced 6.1% in August, accounting for a significant portion of the overall increase in consumer prices. Over the 12 months ended in August, the PCE price index rose 3.5%, 0.1 percentage point higher than the 12-month estimate for the period ended in July. The August 12-month increase in prices excluding food and energy increased 3.9%, down from 4.3% for the 12 months ended in July. Also in August, personal income increased 0.4%, while disposable personal income advanced 0.2%. Consumer spending, as measured by the personal consumption expenditures (PCE) index, increased 0.4% in August, down from the July estimate of 0.9%.
- Sales of single-family homes in August fell 8.7% from the previous month but were 5.8% above the August 2022 estimate. The median sales price of new houses sold in August was $430,300, down from $436,600 in July. The average sales price was $514,000, up from the July estimate of $507,900. The estimate of new homes for sale at the end of August sat at a 7.8-month supply at the current sales pace.
- Durable goods orders increased 0.2% in August after falling 5.6% in July. Excluding transportation, new orders increased 0.4%. Excluding defense, new orders decreased 0.7%. Machinery, up four of the last five months, led the increase after advancing 0.5%. New orders for defense capital goods played a large part in the overall increase in August. New orders for nondefense capital goods in August decreased 2.9%. New orders for defense capital goods in August increased 18.6%.
- The advance report on the international trade in goods (excluding services) deficit for August was $6.6 billion, or 7.3%, lower than the July estimate. Exports increased $3.6 billion, or 2.2%, while imports decreased $3.1 billion, or 1.2%. Since August 2022, exports declined 5.9%, while imports dropped 5.2%.
- The national average retail price for regular gasoline was $3.837 per gallon on September 25, $0.041 per gallon lower than the prior week’s price but $0.126 more than a year ago. Also, as of September 25, the East Coast price decreased $0.056 to $3.598 per gallon; the Midwest price fell $0.071 to $3.639 per gallon; the Gulf Coast price dropped $0.080 to $3.351 per gallon; the Rocky Mountain price declined $0.075 to $3.996 per gallon; and the West Coast price advanced $0.095 to $5.258 per gallon.
- For the week ended September 23, there were 204,000 new claims for unemployment insurance, an increase of 2,000 from the previous week’s level, which was revised up by 1,000. According to the Department of Labor, the advance rate for insured unemployment claims for the week ended September 16 was 1.1%, unchanged from the previous week’s rate. The advance number of those receiving unemployment insurance benefits during the week ended September 16 was 1,670,000, an increase of 12,000 from the previous week’s level, which was revised down by 4,000. States and territories with the highest insured unemployment rates for the week ended September 9 were Hawaii (2.5%), New Jersey (2.3%), California (2.1%), New York (1.8%), Puerto Rico (1.8%), Massachusetts (1.6%), Rhode Island (1.6%), Nevada (1.5%), Oregon (1.5%), and Washington (1.5%). The largest increases in initial claims for unemployment insurance for the week ended September 16 were in Georgia (+1,539), New York (+1,332), South Carolina (+1,103), Texas (+987), and Oregon (+557), while the largest decreases were in Indiana (-2,761), California (-1,498), Virginia (-631), Iowa (-558), and Kentucky (-375).
Eye on the Week Ahead
The employment figures for September are out this week. The labor sector has been strong throughout the year, although the pace of new jobs added has slowed somewhat over the past few months. Hourly earnings continued to increase, rising 4.3% since August 2022.
The Week Ahead

The information provided is obtained from sources believed to be reliable. Forecasts cannot be guaranteed. Past performance is not a guarantee of future results.
© 2021 Broadridge Financial Solutions, Inc. All Rights Reserved.