The market enjoyed a favorable week as each of the benchmark indexes listed here gained ground. Inflation data showed consumer prices moderated in October, while the Federal government avoided a shutdown. Over the last three weeks, the S&P 500, the Nasdaq, and the Dow had their best runs since June 2020, April 2020, and November 2022, respectively. Crude oil prices lost ground for the fourth straight week despite a rally last Friday. The dollar fell to a two-month low. Gold prices ended the week with solid gains.
Stocks opened last Monday with mixed results ahead of Tuesday’s Consumer Price Index report. The Global Dow (0.5%) and the Dow (0.2%) ticked higher, while the small caps of the Russell 2000 were unchanged. The Nasdaq fell 0.2% and the S&P 500 dipped 0.1%. Investors were pensive as they awaited the release of important inflation data over the next few days. Signs that inflation may be cooling could spur a rally in stocks, while a jump in consumer prices could move traders away from the market. Ten-year Treasury yields ticked slightly higher, closing at 4.63%. Crude oil prices rose 1.8% to $78.55 per barrel. The dollar dipped lower, while gold prices rose more than half a percent.
The stock market rallied last Tuesday after the latest inflation data showed price pressures cooled over the last 12 months. The Russell 2000 vaulted 5.4% as small-cap stocks surged, pushing that index into positive territory for the year. The Nasdaq gained 2.4%, the Global Dow added 2.0%, the S&P 500 advanced 1.9%, and the Dow increased 1.4%. The yield on 10-year Treasuries declined 19.1 basis points, falling to 4.44%. Crude oil prices were flat, closing at $78.27 per barrel. The dollar lost 1.5%, while gold prices rose 0.9%.
Last Wednesday produced another day of gains for Wall Street. Both the Producer Price Index and retail sales came in a little softer than expected (see below), which supported the belief that the Fed is done raising interest rates. The Global Dow (0.8%) led the benchmark indexes listed here, followed by the Dow (0.5%), while the Russell 2000 and the S&P 500 rose 0.2%. The Nasdaq edged up 0.1%. Bond prices slid, driving 10-year Treasury yields up 9.4 basis points to 4.53%. Crude oil prices dropped 2.2% to $76.55 per barrel. The dollar gained 0.3%, while gold prices dipped 0.2%.
The markets saw a late-day rally fizzle last Thursday. While the Nasdaq and the S&P 500 ticked up 0.1%, the remaining benchmark indexes listed here ended the day lower, with the small caps of the Russell 2000 (-1.5%) declining the furthest, followed by the Global Dow (-0.3%) and the Dow (-0.1%). Ten-year Treasury yields slipped 9.0 basis points to 4.44%. Crude oil prices plunged nearly 5.0%, settling at $72.93 per barrel, impacted by rising inventories and fears of a global economic slowdown. The dollar was flat, while gold prices jumped 1.0%.
Last Friday was a slow trading day, with stocks moving up and down, ultimately ending the day moderately higher. The Russell 2000 advanced the most after gaining 1.4%. The Global Dow rose 0.6%, while the Nasdaq and the S&P 500 ticked up 0.1%. The Dow ended the day flat. Ten-year Treasury yields moved minimally from the previous day, while crude oil prices recouped some losses after gaining nearly 4.0%. The dollar and gold prices settled lower.
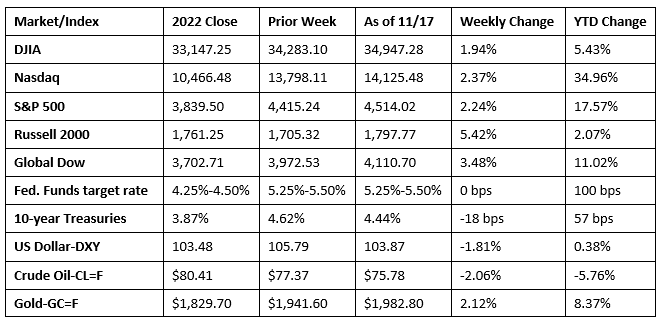
Chart reflects price changes, not total return. Because it does not include dividends or splits, it should not be used to benchmark performance of specific investments.
Last Week’s Economic News
- The Consumer Price Index for October exceeded expectations after rising 0.4%, the same increase as in September. However, over the last 12 months, the CPI increased 3.2%, down from 3.7% for the year ended in September. Consumer prices excluding food and energy rose 0.2% in October and 4.0% over the last 12 months. These figures are down from September, which registered increases of 0.3% and 4.1%, respectively. In October, prices for shelter rose 0.3%, less than the September increase of 0.6%, but high enough to offset a 5.0% decline in gasoline prices. Food prices increased 0.3% in October after rising 0.2% in September.
- The Producer Price Index fell 0.5% in October after rising 0.4% in September. The October decline is the largest decrease in producer prices since a 1.2% drop in April 2020. Producer prices rose 1.3% for the 12 months ended in October. A 1.4% decline in prices for goods accounted for much of the overall decrease in the PPI. Over 80.0% of the October drop in prices for goods was attributable to a 15.3% decrease in prices for gasoline. Prices for services were unchanged in October. Prices less foods, energy, and trade services advanced 0.1% in October, the fifth consecutive rise. For the 12 months ended in October, prices less foods, energy, and trade services moved up 2.9%.
- Retail sales slipped 0.1% in October but increased 2.5% since October 2022. Retail trade sales were down 0.2% last month but up 1.6% over the past 12 months. Most businesses saw sales decrease in October, with the largest declines occurring for furniture and home furnishing stores (-2.0%); online stores (-1.7%); and motor vehicle and parts dealers (-1.0%). Gasoline station sales declined 0.3% in October and 7.5% over the last 12 months.
- Both import and export prices declined in October. Import prices declined 0.8% in October after increasing 0.4% in September. This is the first monthly drop in import prices since June 2023, and was the largest decrease since March 2023. Prices for U.S. imports decreased 2.0% for the year ended October 2023. A decrease in both fuel and nonfuel prices contributed to the overall decline in import prices. Fuel prices fell 6.3% in October, after advancing 6.3% the previous month. The October drop was the first monthly decrease since May 2023 and the largest monthly decline since September 2022. Nonfuel import prices declined 0.2% for the third consecutive month in October. Export prices dropped 1.1% in October after declining 0.5% in the previous month. The decline in October was the largest monthly drop since a 2.1% decrease in May 2023. Lower prices for nonagricultural and agricultural exports each contributed to the October decline. Export prices fell 4.9% for the year ended in October.
- Industrial production declined 0.6% in October. Manufacturing output fell 0.7%, primarily due to a 10% drop in the output of motor vehicles and parts related to strikes at several major manufacturers of motor vehicles. Excluding motor vehicles and parts, manufacturing edged up 0.1%. Utilities fell 1.6% and mining dipped 0.4%. Total industrial production in October was 0.7% below its level from a year earlier.
- October saw the number of residential construction building permits increase by 1.1% over September’s total, although October’s rate is 4.4% below the October 2022 mark. Building permits for single-family home construction also increased 0.5% in October. The number of housing starts rose 1.9% in October but is 4.2% below the prior year’s total. Single-family housing starts in October were 0.2% above the September figure. Home completions declined 4.6% in October but were 4.6% above the October 2022 rate. Single-family home completions dipped 0.9% last month.
- October, the first month of fiscal year 2024, saw the monthly federal government deficit sit at $67.0 billion, down from $171.0 billion in September and below the October 2022 budget deficit of $87.9 billion. In October, of the $403.0 billion in receipts, individual income taxes accounted for $220.0 billion. October outlays were $470.0 billion, with Social Security payments of $117.0 billion exceeding all other outlays.
- The national average retail price for regular gasoline was $3.349 per gallon on November 13, $0.047 per gallon lower than the prior week’s price and $0.413 less than a year ago. Also, as of November 13, the East Coast price decreased $0.040 to $3.212 per gallon; the Midwest price fell $0.025 to $3.185 per gallon; the Gulf Coast price declined $0.062 to $2.809 per gallon; the Rocky Mountain price dropped $0.118 to $3.338 per gallon; and the West Coast price decreased $0.077 to $4.520 per gallon.
- For the week ended November 11, there were 231,000 new claims for unemployment insurance, an increase of 13,000 from the previous week’s level, which was revised up by 1,000. According to the Department of Labor, the advance rate for insured unemployment claims for the week ended November 4 was 1.3%, an increase of 0.1 percentage point from the previous week’s rate. The advance number of those receiving unemployment insurance benefits during the week ended November 4 was 1,865,000, an increase of 32,000 from the previous week’s level, which was revised down by 1,000. This is the highest level for insured unemployment since November 27, 2021, when it was 1,964,000. States and territories with the highest insured unemployment rates for the week ended October 28 were New Jersey (2.1%), California (2.0%), Hawaii (2.0%), Puerto Rico (1.9%), Alaska (1.7%), Massachusetts (1.6%), New York (1.6%), Washington (1.6%), Oregon (1.5%), and Rhode Island (1.5%). The largest increases in initial claims for unemployment insurance for the week ended November 4 were in California (+2,910), New York (+2,245), Pennsylvania (+1,704), New Jersey (+1,689), and Texas (+1,522), while the largest decreases were in Oregon (-2,529), Kentucky (-788), North Carolina (-522), Oklahoma (-108), and Mississippi (-107).
Eye on the Week Ahead
Thanksgiving week includes the release of the October figures on existing home sales. September saw sales decline 2.0%. Also out this week is the latest data on durable goods orders for October. Durable goods orders rose 4.7% in September after declining in each of the previous two months.
The Week Ahead

The information provided is obtained from sources believed to be reliable. Forecasts cannot be guaranteed. Past performance is not a guarantee of future results.
© 2021 Broadridge Financial Solutions, Inc. All Rights Reserved.