Stocks notched their eighth straight week of gains heading into the holiday-shortened week. While trading was generally light, investors remained bullish toward stocks as traders clung to the hope that the economy has survived the restrictive inflation-reducing policy of the Federal Reserve. The S&P 500 enjoyed its longest weekly winning streak since late 2017, while the Nasdaq and the Dow marked the streaks since early 2019. With one week to go in 2023, the S&P 500 is within 1.0% of reaching its all-time high, achieved in January 2022. The Russell 2000, which was below its 2022 closing value in August, now is more than 15.0% above that level. Investors were also encouraged by economic data released last week, which showed inflation continuing to trend lower, while new orders for durable goods advanced, a good sign for corporations. Crude oil prices ticked higher but remained below $75.00 per barrel. Yields on 10-year Treasuries moved marginally lower, while the dollar weakened on declining interest rates.
Equities edged higher to begin last Monday in what was expected to be a week of modest trading leading up to the Christmas holiday. The Nasdaq led the benchmark indexes listed here, gaining 0.6%, while the S&P 500 rose 0.5%. The Dow was flat, the Russell 2000 and the Global Dow ticked down 0.1%. Megacaps performed well, while communication services and consumer staples led the market sectors. Ten-year Treasury yields inched up 2.6 basis points to 3.95%. Crude oil prices ended relatively flat, while the dollar and gold prices dipped lower.
Stocks jumped higher last Tuesday. The Dow achieved its fifth straight record close after gaining 0.7%. The Nasdaq and the Global Dow also rose 0.7%, while the S&P 500 gained 0.6%. The big winner, however, was the Russell 2000, which climbed 2.0%. Yields on 10-year Treasuries closed at 3.92% after falling 3.2 basis points. Crude oil prices continued to rally, gaining 1.5% to $73.58 per barrel. The dollar slipped 0.4%, while gold prices rose 0.6%.
Wall Street cooled last Wednesday as investors may have taken some gains following a record-setting rally. Each of the benchmark indexes listed here lost ground. The Russell 2000 fell 1.6%, while the S&P 500 and the Nasdaq each dropped 1.5%. The Dow declined 1.3% and the Global Dow dipped 0.8%. Bonds continued to advance, with yields on 10-year Treasuries falling 4.5 basis points to 3.87%. Crude oil prices slipped to $73.79 per barrel after declining 0.2%. The dollar edged up, while gold prices dipped lower.
Last Thursday saw stocks rebound as the Russell 2000 (1.7%), the Nasdaq (1.3%), and the S&P 500 (1.0%) each closed the session up by at least 1.0%. The Dow gained 0.9% and the Global Dow added 0.6%. Ten-year Treasury yields inched up less than 2.0 basis points to 3.89%. Crude oil prices slipped to $74.02 per barrel. The dollar fell 0.6%, while gold prices rose 0.4%.
Stocks closed generally higher last Friday. The Nasdaq and the S&P 500 ticked up 0.2%, the Russell 2000 added 0.1%, while the Global Dow and the Dow broke even. Ten-year Treasury yields changed little, closing at 3.90%. Crude oil prices dipped 0.4%. The dollar edged lower, while gold prices rose 0.7%.
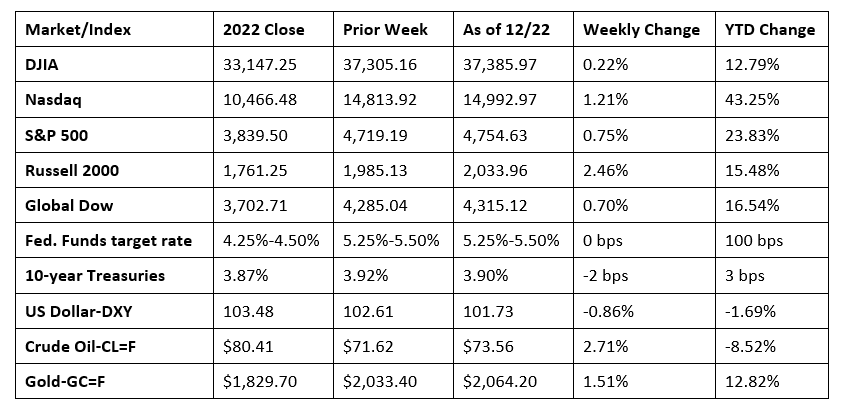
Chart reflects price changes, not total return. Because it does not include dividends or splits, it should not be used to benchmark performance of specific investments.
Last Week’s Economic News
- The third and final estimate of third-quarter gross domestic product showed the economy accelerated at an annualized rate of 4.9%. The second quarter GDP rose 2.1%. Personal consumption expenditures, the main driver of GDP, expanded at a rate of 3.1%. Consumer spending on goods increased 4.9%, while spending on services rose 2.2%. Overall fixed investment advanced 2.5%, with nonresidential fixed investment moving up 1.4%, while residential fixed investment increased 6.7%. Exports rose 5.4%, while imports, which are a negative in the calculation of GDP, advanced 4.2%. Consumer prices ticked up 2.6% in the third quarter, while prices less food and energy, rose 2.0%.
- Recent data continues to evidence declining inflation. The November personal consumption expenditures price index declined 0.1% last month after being flat in October. Core prices, excluding food and energy, inched up 0.1% in November following a 0.2% increase the previous month. More importantly, the overall price index and core prices declined over the 12 months ended in November. The PCE price index fell 0.4 percentage point to 2.6%, while core prices dipped 0.3 percentage point to 3.2%. In November, consumer spending rose 0.2%, after rising 0.1% in October. Personal income and disposable (after-tax) income rose 0.4% last month following a 0.3% increase in October.
- New home construction may be picking up. While the number of building permits issued in November for all residential construction declined 2.5% from the previous month, building permits were up 4.1% over the November 2022 estimate. The number of single-family housing permits rose 0.7% last month and 22.8% above the year earlier total. Housing starts in November were 14.8% above the October estimate and 9.3% over the November 2022 rate. Single-family housing starts were 18.0% above the October pace. Housing completions in November were 5.0% over the October estimate but 6.2% below the November 2022 rate. Housing completions in November for single family homes were 3.2% under the October rate.
- Sales of existing homes advanced 0.8% in November, the first monthly increase since May. However, sales were down 7.3% over the last 12 months. The median existing home sales price was $387,600 in November ($391,600 in October), up from $372,700 in November 2022. Inventory of available existing homes for sale sat at a 3.5-month supply. According to the National Association of Realtors®, the average 30-year fixed mortgage rate, at 6.95%, fell below 7.0% for the first time since August. Sales of existing single-family homes also rose in November after climbing 0.9%. Sales remained down, (-7.3%), from a year ago. The median existing single-family home price was $392,100 in November ($396,000 in October), up from $378,700 from a year ago. Inventory of existing single-family homes available for sale sat at a 3.5-month pace.
- Sales of new single-family homes dropped 12.2% in November and were up only 1.4% over the last 12 months. The decline in sales was likely due to rising mortgage rates in October and November. In addition, sales were uneven throughout the country, where sales in the South and West decreased 20.9% and 5.1%, respectively. Conversely, sales in the Midwest and Northeast advanced 25.0% and 3.1%, respectively. Inventory rose to a 9.2-month supply in November, up from 7.9 months in October and the highest since November 2022. The median sales price was $434,700 in November, up from $414,900 in October. The average sales price was $488,900, down from October’s price of $498,500.
- New orders for manufactured durable goods in November, up two of the last three months, rose 5.4% to $295.4 billion. Excluding transportation, new orders increased 0.5%. Excluding defense, new orders increased 6.5%. Transportation equipment, also up two of the last three months, led the increase, advancing 15.3%. New orders for nondefense capital goods in November increased 17.1%. New orders for defense capital goods in November decreased 12.0%.
- The national average retail price for regular gasoline was $3.053 per gallon on December 18, $0.083 per gallon lower than the prior week’s price and $0.067 less than a year ago. Also, as of December 18, the East Coast price decreased $0.073 to $3.050 per gallon; the Midwest price fell $0.103 to $2.798 per gallon; the Gulf Coast price declined $0.075 to $2.547 per gallon; the Rocky Mountain price dropped $0.091 to $2.808 per gallon; and the West Coast price decreased $0.086 to $4.055 per gallon.
- For the week ended December 16, there were 205,000 new claims for unemployment insurance, an increase of 2,000 from the previous week’s level, which was revised up by 1,000. According to the Department of Labor, the advance rate for insured unemployment claims for the week ended December 9 was 1.3%, unchanged from the previous week’s rate. The advance number of those receiving unemployment insurance benefits during the week ended December 9 was 1,865,000, a decrease of 1,000 from the previous week’s level, which was revised down by 10,000. States and territories with the highest insured unemployment rates for the week ended December 2 were New Jersey (2.3%), Alaska (2.2%), California (2.2%), Minnesota (1.9%), Puerto Rico (1.9%), Washington (1.9%), Hawaii (1.8%), Massachusetts (1.8%), Rhode Island (1.8%), and New York (1.7%). The largest increases in initial claims for unemployment insurance for the week ended December 9 were in Nevada (+329), Massachusetts (+298), Michigan (+279), Arizona (+259), and North Carolina (+173), while the largest decreases were in New York (-6,720), Pennsylvania (-4,311), Texas (-3,715), Kentucky (-3,707), and California (-3,618).
Eye on the Week Ahead
Christmas week is a slow one for the release of economic news. The advance report on international trade in goods for November is out toward the end of the week. The trade in goods deficit was $89.6 billion in October, largely due to a 1.4% decrease in exports.
The Week Ahead

The information provided is obtained from sources believed to be reliable. Forecasts cannot be guaranteed. Past performance is not a guarantee of future results.
© 2021 Broadridge Financial Solutions, Inc. All Rights Reserved.