Stocks finished the month of March in solid fashion. Each of the benchmark indexes listed here posted gains, with the exception of the Nasdaq. Bond yields dipped lower. Crude oil prices advanced, while energy shares ended up being a top performer. The dollar inched higher, while gold prices continued to climb.
Investors seemed to take a breath to begin last week, as stocks ticked lower by the close of trading last Monday. Of the benchmark indexes listed here, only the Russell 2000 was able to eke out a minimal 0.1% gain. The Dow fell 0.4%, while the Nasdaq and the S&P 500 dipped 0.3%, and the Global Dow lost 0.1%. Ten-year Treasury yields gained 3.5 basis points to 4.25%. Crude oil prices reached $82.02 per barrel after gaining $1.39. The dollar slipped 0.3%, while gold prices rose 0.6%.
Last Tuesday saw stocks lose steam after a favorable start to the day, ultimately closing lower for the second straight day. The Nasdaq fell 0.4%, the S&P 500 lost 0.3%, the Russell 2000 dropped 0.2%, the Dow slipped 0.1%, while the Global Dow broke even. Ten-year Treasury yields settled at 4.23%. Crude oil prices lost $0.50 to close at about $81.46 per barrel. The dollar and gold prices inched up minimally.
Stocks finally rebounded last Wednesday, ending a short-lived slump. Each of the benchmark indexes listed here posted notable gains, led by the Russell 2000, which rose 2.1%. the Dow climbed 1.2%, followed by the S&P 500 (0.9%), the Global Dow (0.8%), and the Nasdaq (0.5%). Ten-year Treasury yields declined 3.8 basis points to 4.19%. Crude oil prices ticked up marginally to $81.70 per barrel. The dollar was flat, while gold prices rose 0.7%. Real estate and utilities led the market sectors.
Wall Street closed the holiday week on Thursday, with equities generally advancing. The Russell 2000 gained 0.5%, while the Dow and the S&P 500 eked out 0.1% increases. The Nasdaq dipped 0.1%, while the Global Dow was flat. Ten-year Treasury yields inched up 1.0 basis point to close at 4.20%. The dollar rose 0.2%, while gold prices jumped 1.3%.
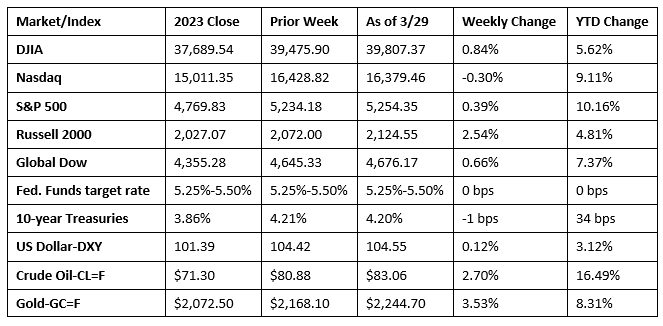
Chart reflects price changes, not total return. Because it does not include dividends or splits, it should not be used to benchmark performance of specific investments.
Last Week’s Economic News
- Personal income rose 0.3% and disposable personal income advanced 0.2% in February, according to the latest data from the Bureau of Economic Analysis. Consumer spending, as measured by personal consumption expenditures, increased 0.8%. The personal consumption expenditures price index increased 0.3%, about where analysts expected. Excluding food and energy, prices rose 0.3%. Over the last 12 months, prices increased 2.5%, while core prices, excluding food and energy, advanced 2.8%.
- Gross domestic product rose at an annual rate of 3.4% in the fourth quarter, according to the third and final estimate released by the Bureau of Economic Analysis. GDP increased by 4.9% in the third quarter. Compared to the third quarter of 2023, the deceleration in GDP in the fourth quarter primarily reflected a downturn in private inventory investment and slowdowns in federal government spending and residential fixed investment. Imports decelerated. The personal consumption expenditures (PCE) price index increased 1.8%, while the PCE index excluding food and energy prices increased 2.0%. Personal consumption expenditures rose 3.3% in the fourth quarter, nonresidential fixed investment increased 3.7%, and residential fixed investment rose 2.8%. Exports advanced 5.1%, while imports edged up 2.2%.
- The advance report on international trade in goods showed the deficit rose 1.5% in February. Exports increased 2.8%, while imports rose 2.3%. Since February 2023, exports are up 3.6% and imports climbed 2.8%.
- Sales of new single-family homes dipped 0.3% in February, but were 5.9% above the February 2023 estimate. The median sales price in February was $400,500, while the average sales price was $485,000. February inventory of new single-family homes for sale sat at a supply of 8.4 months at the current sales pace.
- New orders for manufactured durable goods in February rose 1.4%, marking the first monthly increase since November 2023. Excluding transportation, new orders increased 0.5%. Excluding defense, new orders increased 2.2%. Transportation equipment, also up following two consecutive monthly decreases, led the increase, rising 3.3%. New orders for nondefense capital goods in February increased 4.4%. New orders for defense capital goods in February decreased 12.7%.
- The national average retail price for regular gasoline was $3.523 per gallon on March 25, $0.070 per gallon greater than the prior week’s price and $0.102 per gallon more than a year ago. Also, as of March 25, the East Coast price increased $0.039 to $3.388 per gallon; the Midwest price rose $0.097 to $3.406 per gallon; the Gulf Coast price increased $0.077 to $3.176 per gallon; the Rocky Mountain price rose $0.126 to $3.292 per gallon; and the West Coast price increased $0.080 to $4.460 per gallon.
- For the week ended March 23, there were 210,000 new claims for unemployment insurance, a decrease of 2,000 from the previous week’s level, which was revised up by 2,000. According to the Department of Labor, the advance rate for insured unemployment claims for the week ended March 16 was 1.2%, unchanged from the previous week’s rate. The advance number of those receiving unemployment insurance benefits during the week ended March 16 was 1,819,000, an increase of 24,000 from the previous week’s level, which was revised down by 12,000. States and territories with the highest insured unemployment rates for the week ended March 9 were New Jersey (2.8%), Rhode Island (2.6%), California (2.4%), Minnesota (2.4%), Massachusetts (2.3%), Illinois (2.1%), New York (2.0%), Connecticut (1.9%), Montana (1.9%), Pennsylvania (1.9%), and Washington (1.9%). The largest increases in initial claims for unemployment insurance for the week ended March 16 were in Missouri (+1,443), Michigan (+1,204), Tennessee (+538), Mississippi (+353), and Arkansas (+279), while the largest decreases were in California (-5,794), Oregon (-1,651), Texas (-856), Pennsylvania (-740), and Illinois (-626).
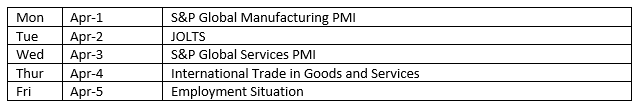
Eye on the Week Ahead
The March employment data is available this week. Employment rose by 275,000 in February as the labor sector continued to show strength. The March surveys of purchasing managers for the manufacturing and services industries are also out this week. February saw both sectors expand.
The Week Ahead
The information provided is obtained from sources believed to be reliable. Forecasts cannot be guaranteed. Past performance is not a guarantee of future results.
© 2021 Broadridge Financial Solutions, Inc. All Rights Reserved.